Overview
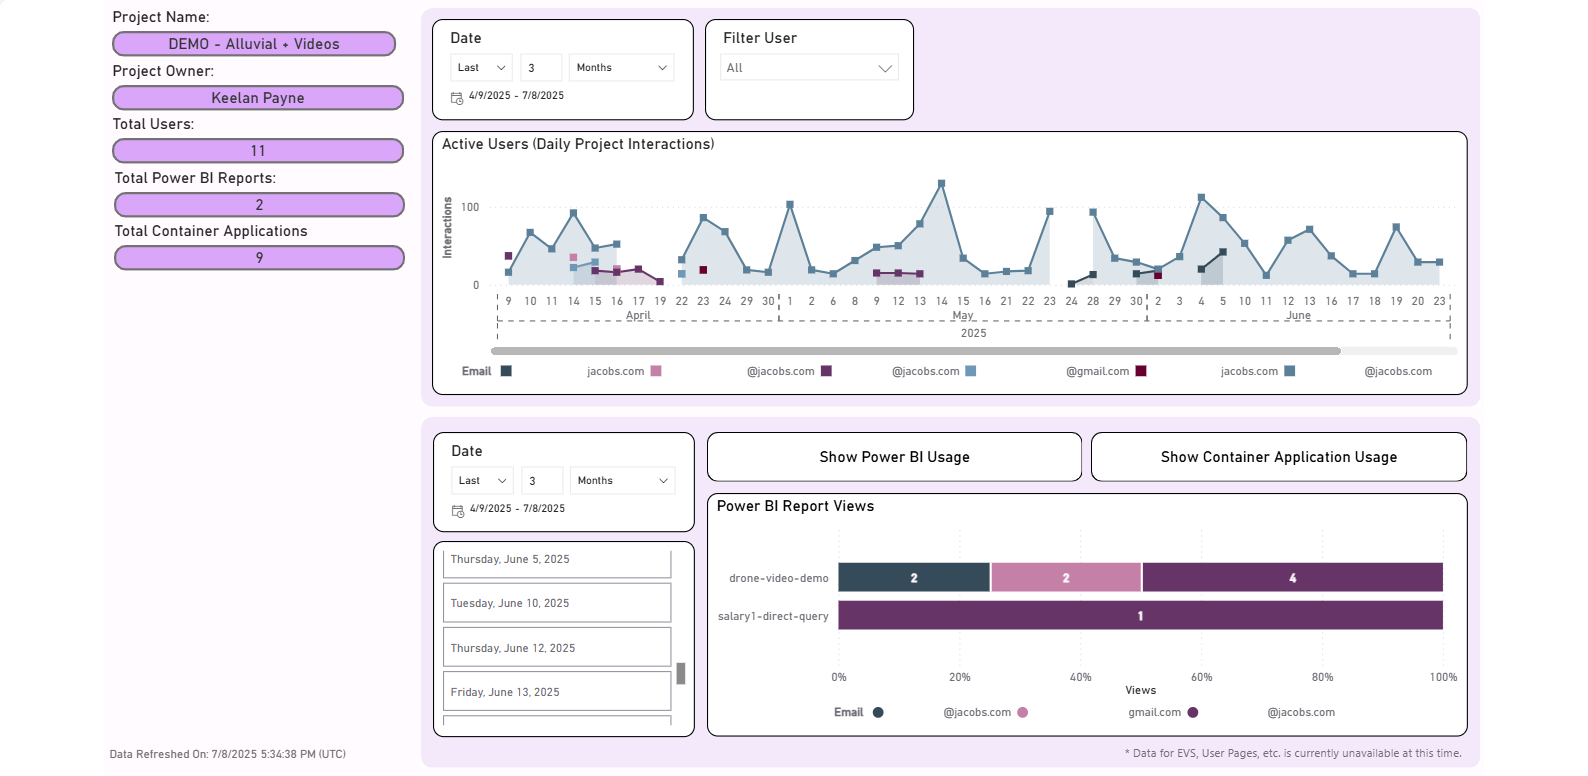
The Workspaces & Reports Statistics dashboard in Alluvial provides insights into how users are interacting with content—particularly Power BI reports and container applications—within your project.
Accessing the Statistics Dashboard
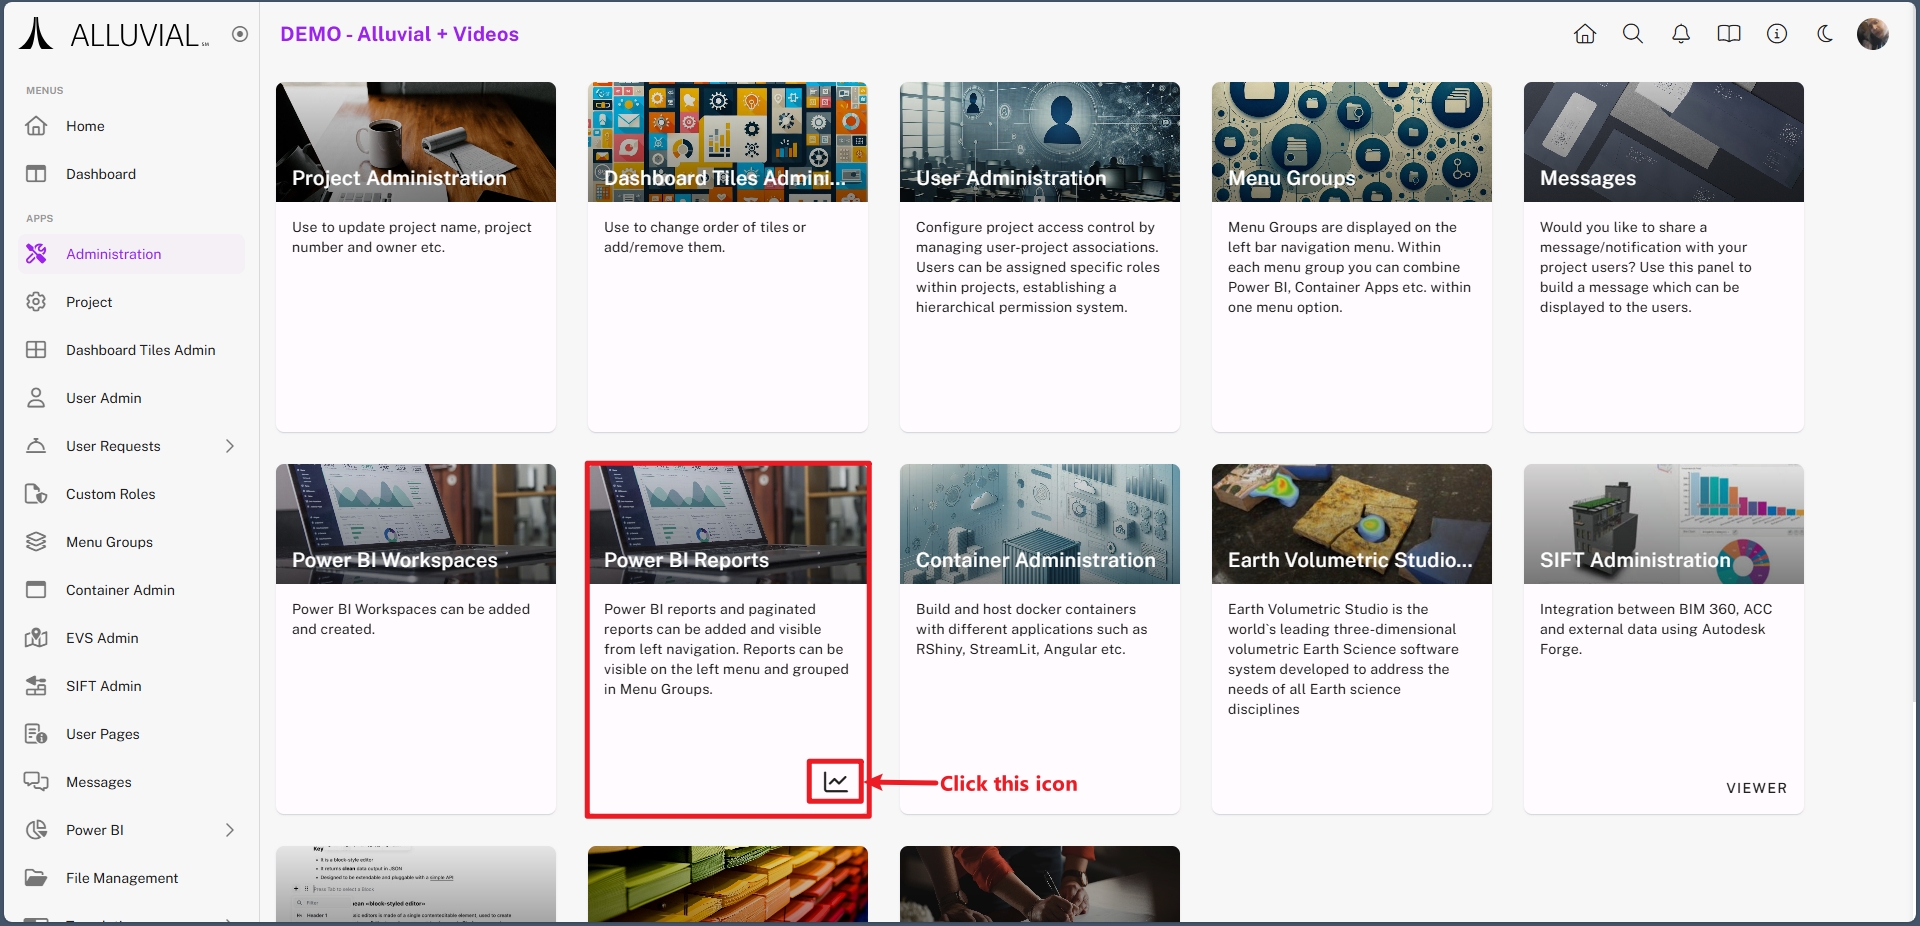
- Go to the administration page for your project.
- In the Power BI Reports card, click Statistics.

Available Metrics
The dashboard displays:
- Power BI usage
- Container application usage
- Overall user interactions across the project
You can use the built-in filters to refine results by:
- Date range
- User
This allows you to generate targeted insights for performance monitoring and usage tracking.

NOTE: Metrics are estimates generated from page clicks and page views. They may not represent exact usage counts.