Overview
Alluvial supports embedding Power BI visualizations directly into the platform, enabling seamless sharing and collaboration with both internal and external project users.
Getting Started
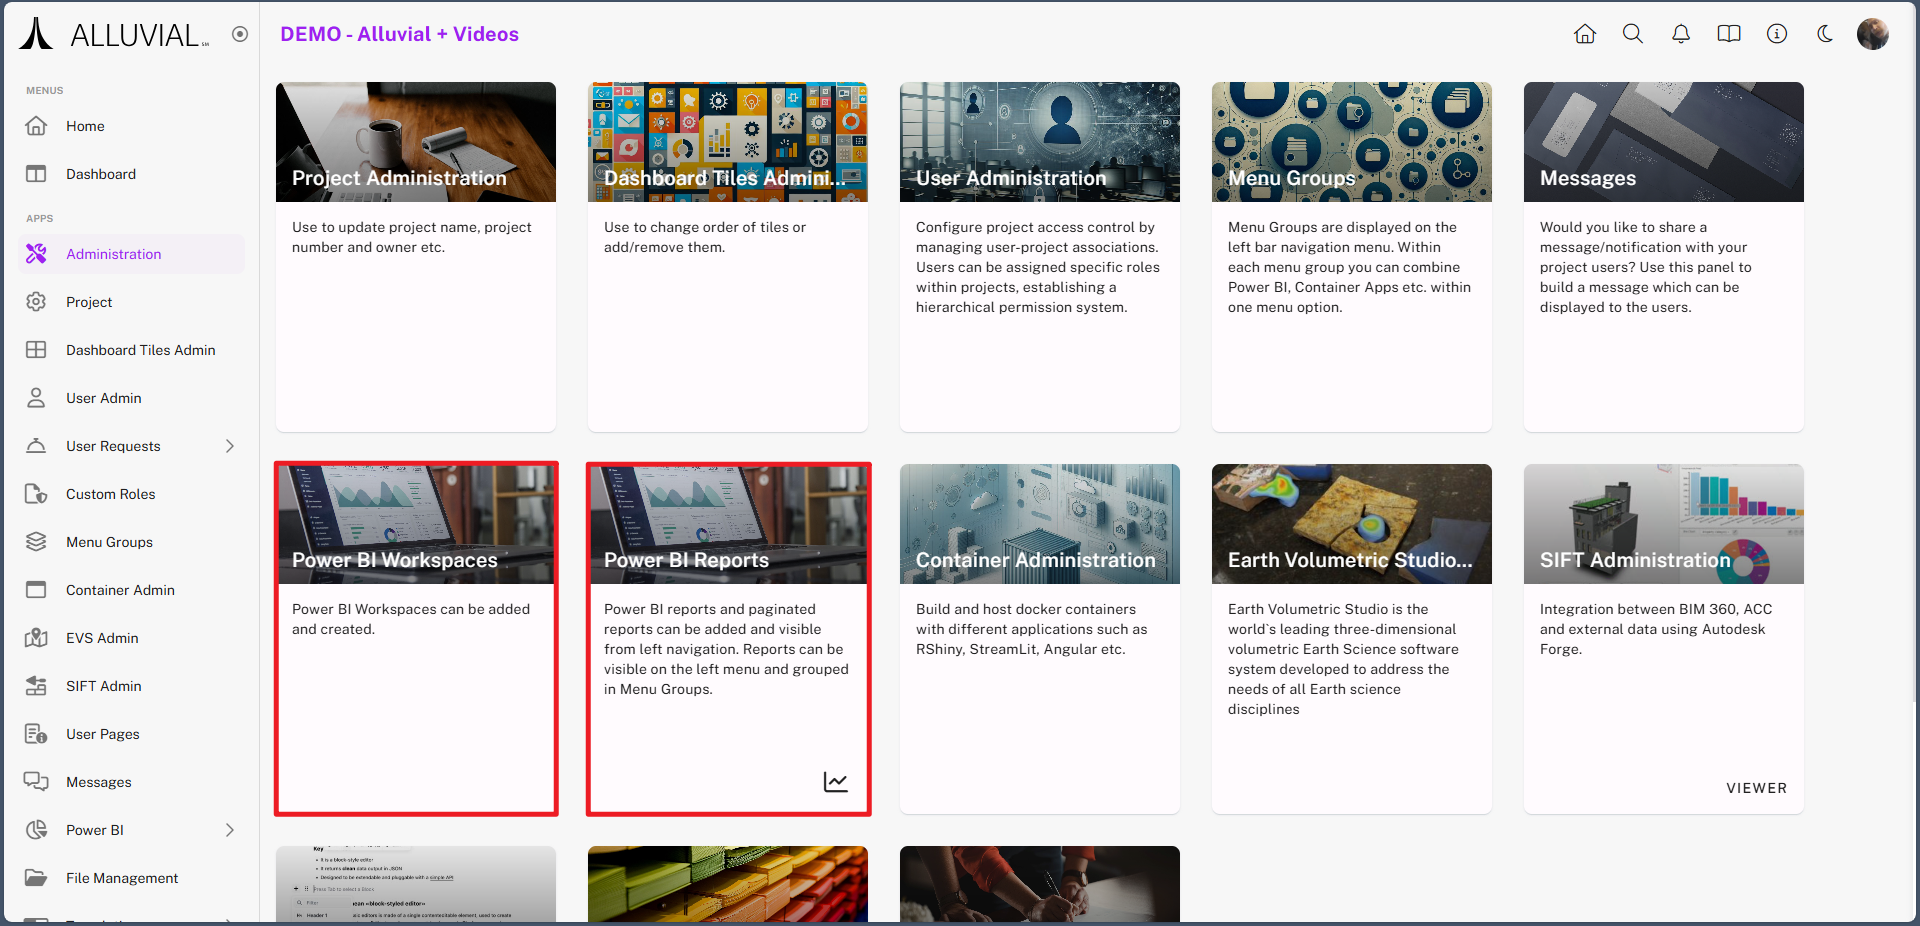
Access the Module
- Navigate to the administration page.
- Select either Power BI Workspaces or Power BI Reports. (This example uses Power BI Workspaces.)
Core Concepts
What Is Power BI?
Power BI is Microsoft’s cloud-based business intelligence and data visualization platform. It allows organizations to connect to diverse data sources, transform raw data into meaningful insights, and share interactive reports and dashboards across teams.
Key Features
- Data Connectivity – Connect to cloud services, databases, spreadsheets, and APIs.
- Data Modeling – Clean, transform, and structure data for reporting.
- Interactive Visualizations – Build charts, dashboards, and custom visuals for exploration and analysis.
- Collaboration – Securely share insights across your organization or with external stakeholders.
Common Tasks
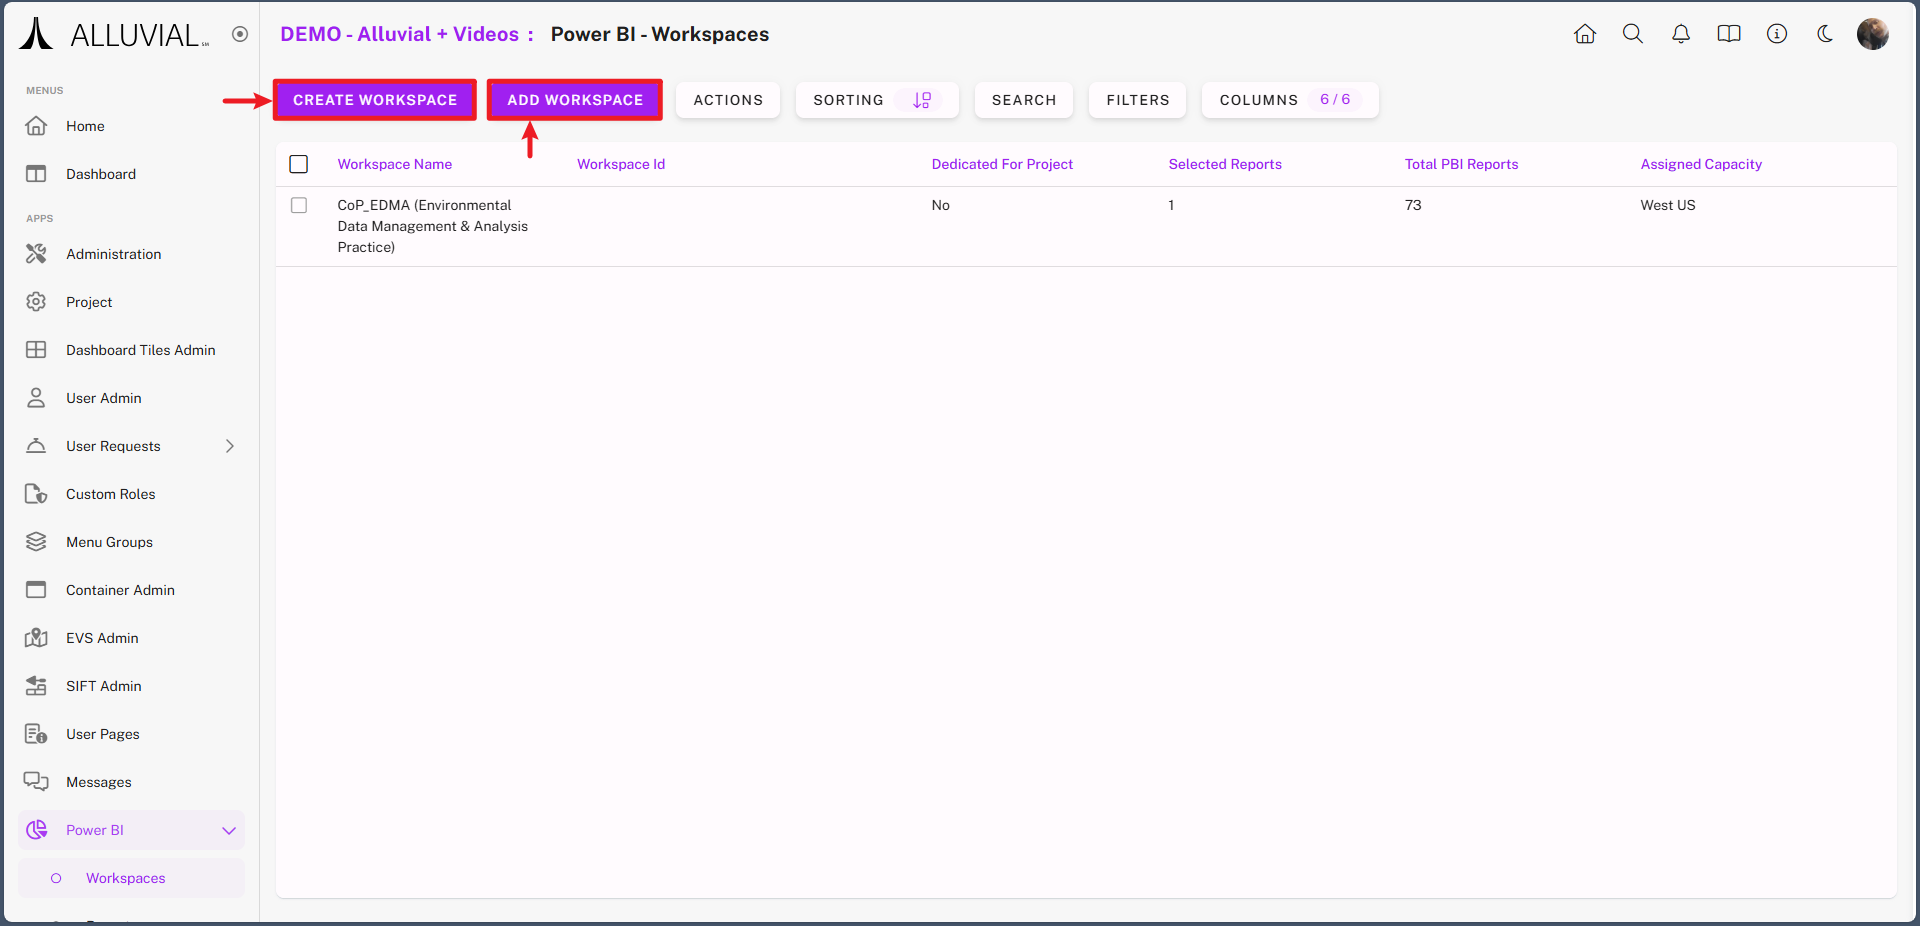
Add an Existing Power BI Workspace
- View the list of existing Power BI workspaces associated with your project.
- Click ADD WORKSPACE.
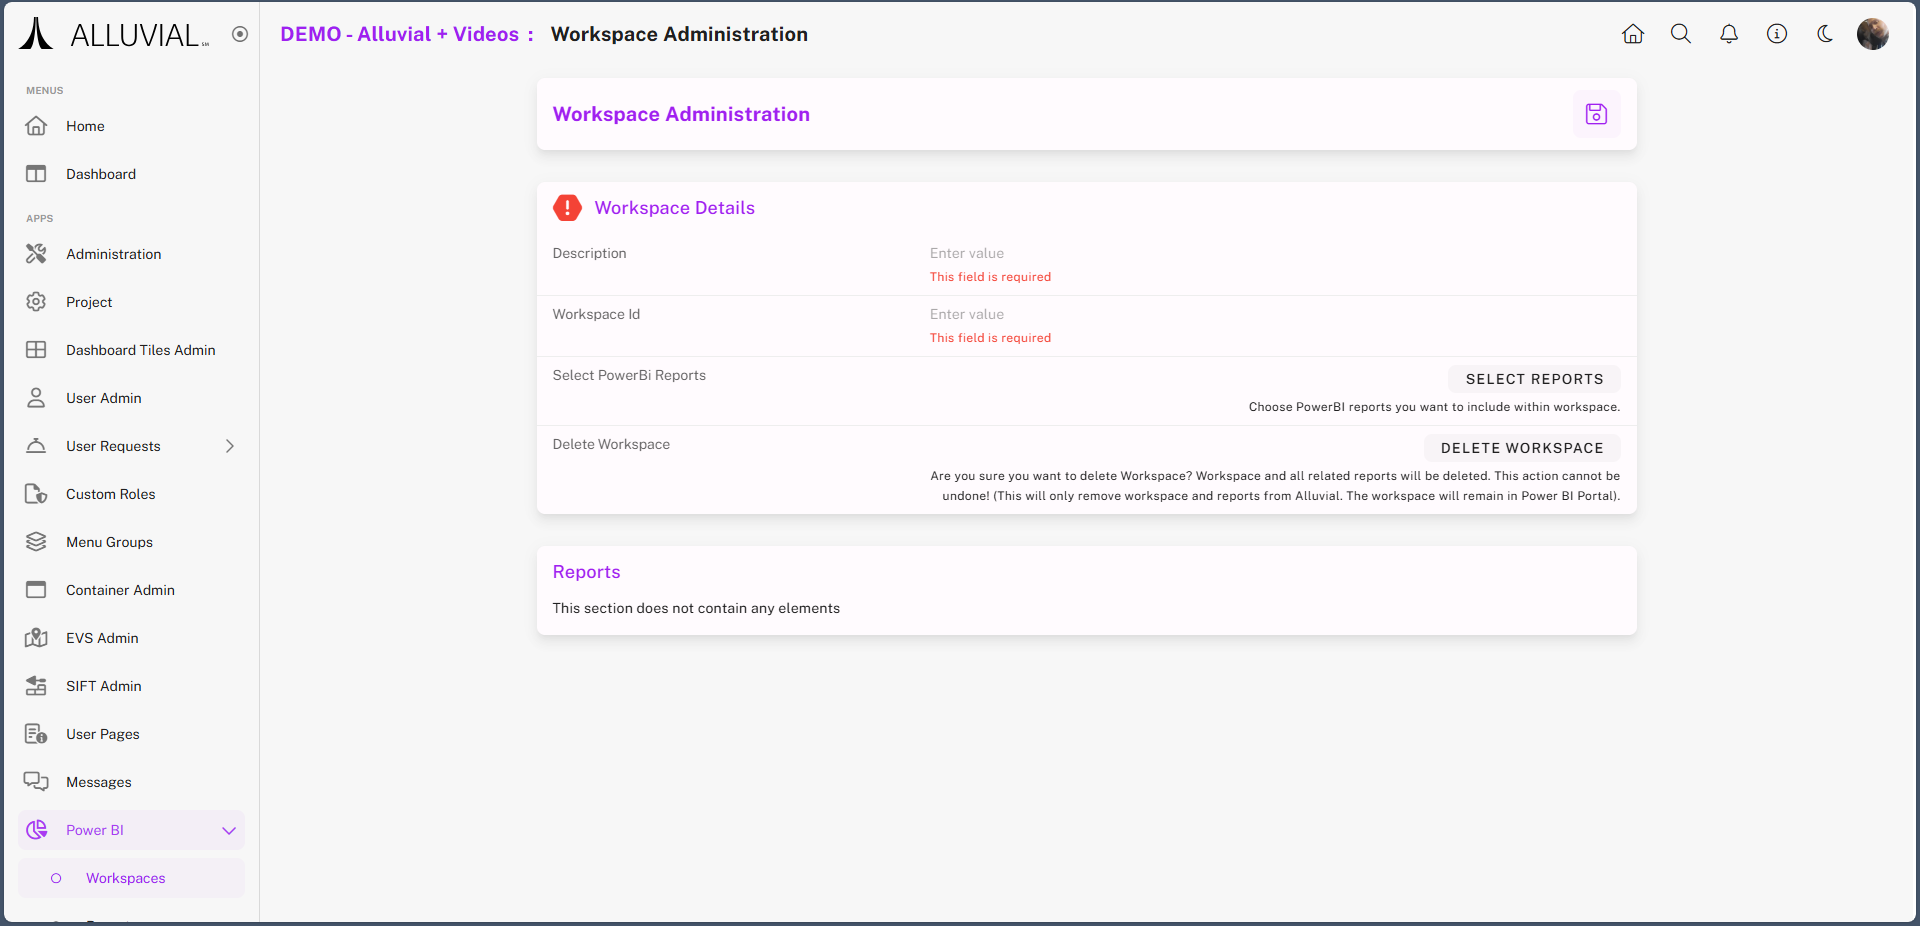
Complete the Workspace Form
- Fill in the form details.
- Locate your Workspace ID:
- Go to https://app.powerbi.com
- Select the desired workspace from the navigation
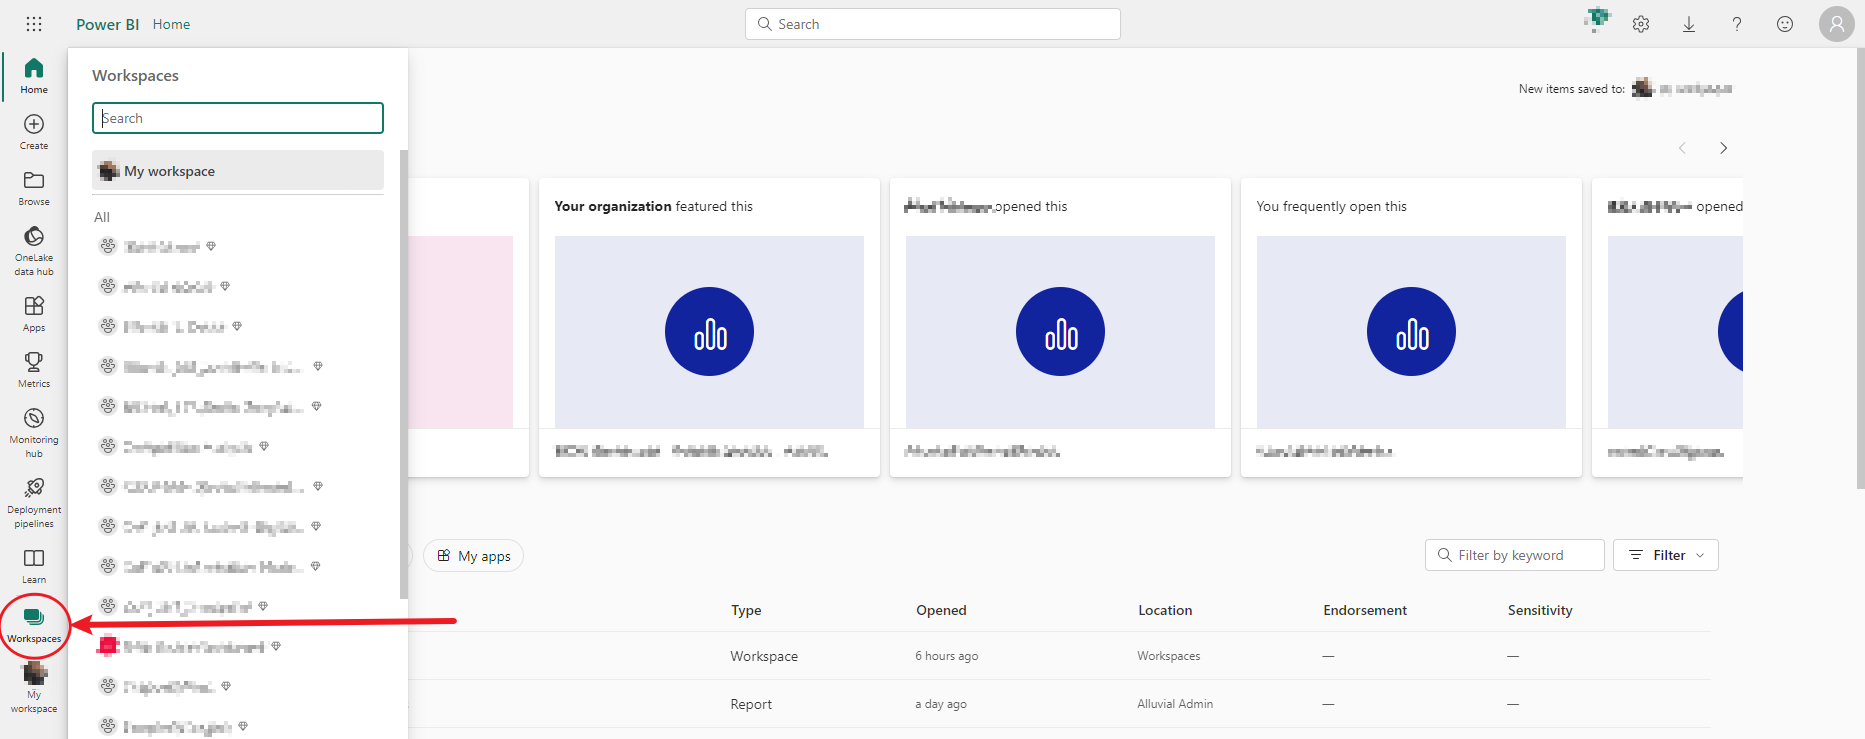
- Copy the alphanumeric ID from the URL (do not include slashes)

- Paste the Workspace ID into the form.
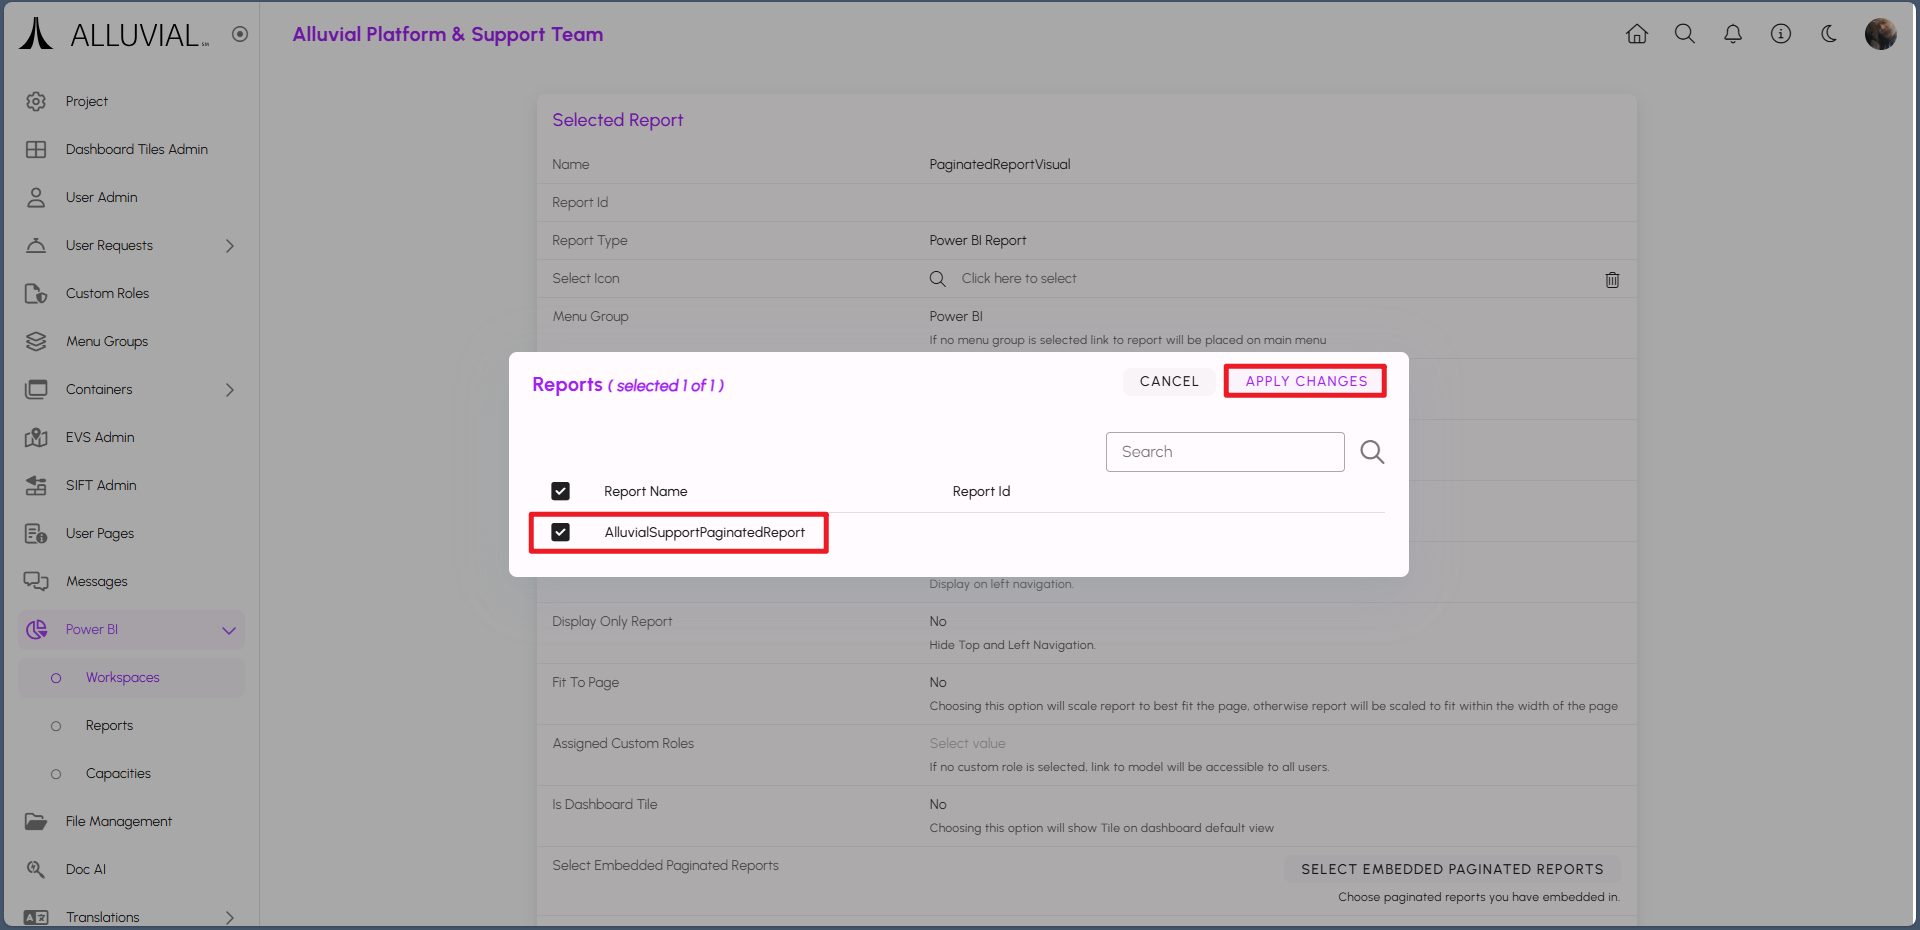
- Click SELECT REPORTS.
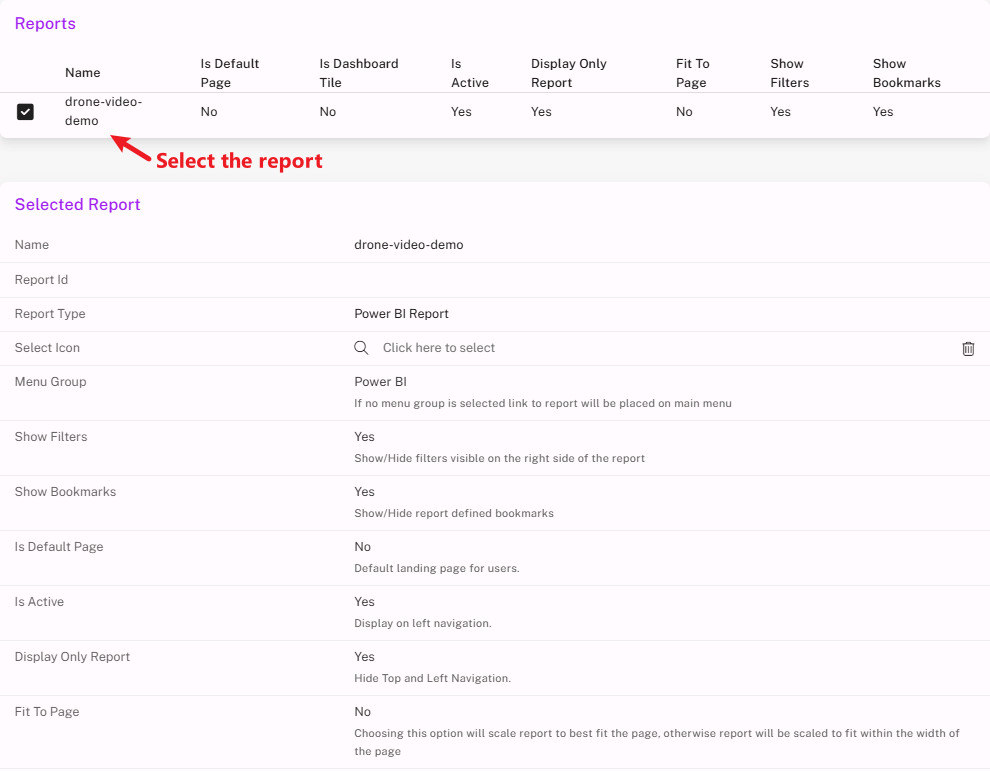
- In the dialog, choose the desired reports and click APPLY CHANGES.
The Reports section will now list the selected reports for configuration:
Create a New Power BI Workspace
If you don’t already have a Power BI workspace, you can create one directly from Alluvial.
IMPORTANT: Only one new workspace can be created per Alluvial project.
- In the admin panel, click ACTIONS → CREATE WORKSPACE.

- Complete the creation form.
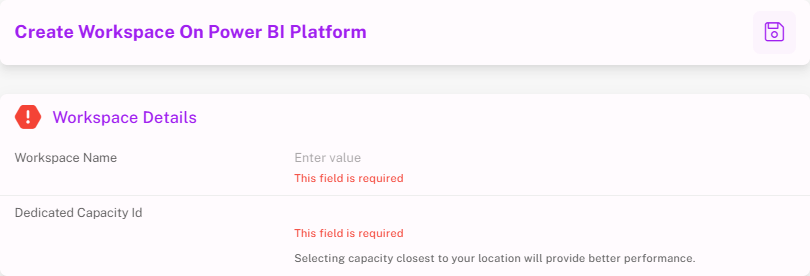
IMPORTANT: If your users are in multiple locations, choose a workspace capacity closest to the majority.
Additional Functionality
The following sections cover Power BI capabilities supported within or commonly used alongside Alluvial.
Power BI Bookmarks
Bookmarks allow report designers to capture the current state of a report page, including applied filters, slicers, drill-through positions, and the visibility of visuals, and return to that exact state with a single click. This functionality is particularly useful for creating guided experiences, enabling storytelling, and simplifying navigation between different views without duplicating pages.
IMPORTANT: For more detailed information on creating bookmarks using Power BI, refer to the official Microsoft Power BI documentation.
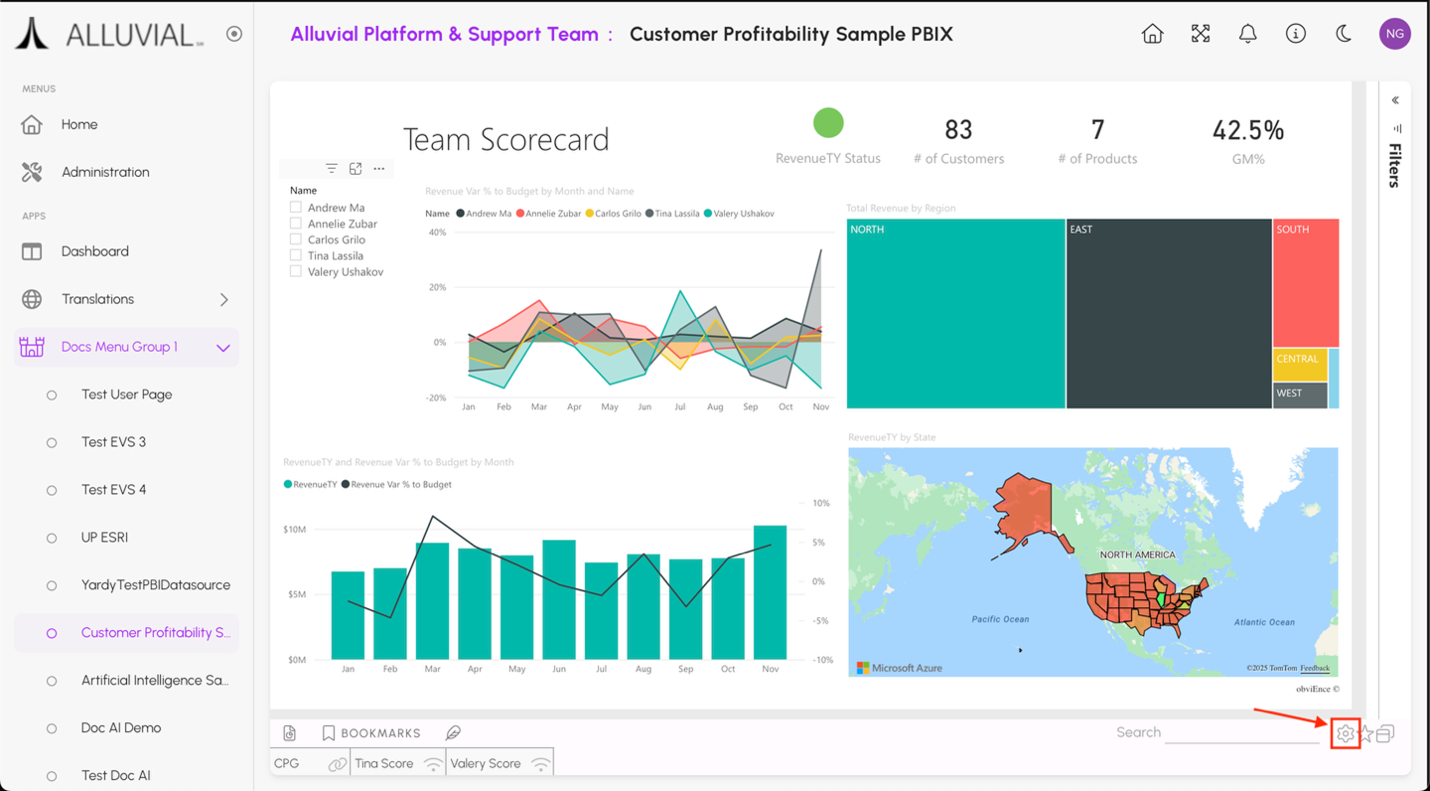
Access Bookmark Controls
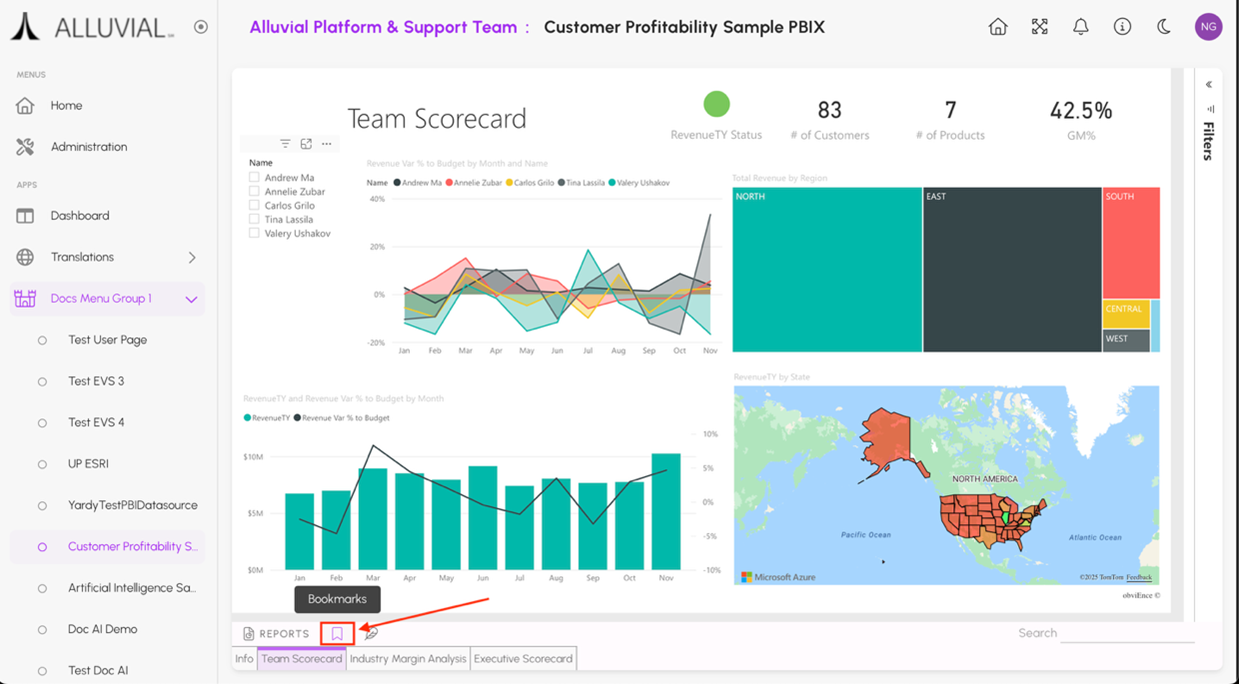
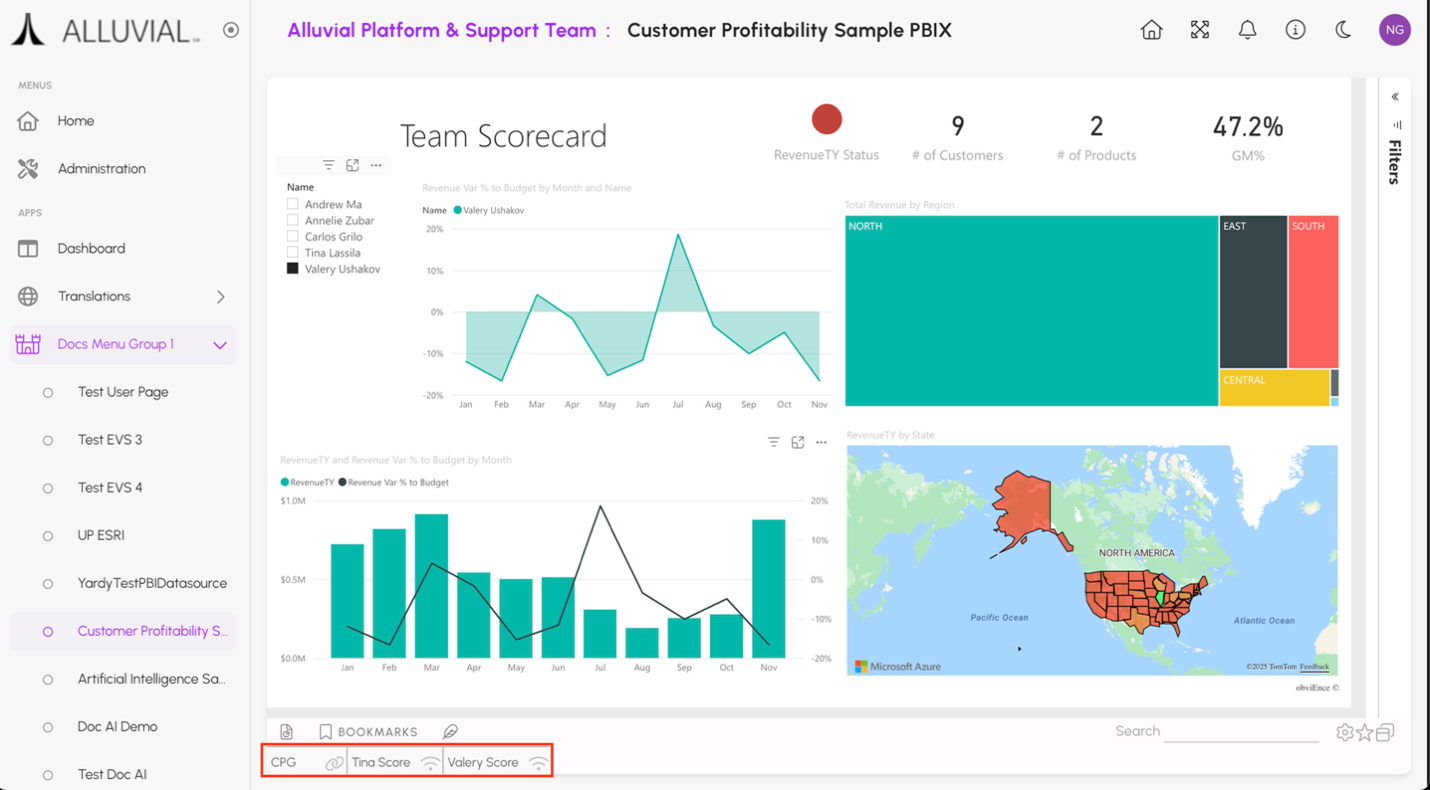
Bookmark controls are located at the bottom of each report. You’ll see three options:
- Bookmarks Management – Opens the management panel to view, edit, and organize bookmarks
- Capture Bookmark – Creates a new bookmark from the current report state
- Clear Bookmark – Removes all bookmark-applied filters and returns to the default view
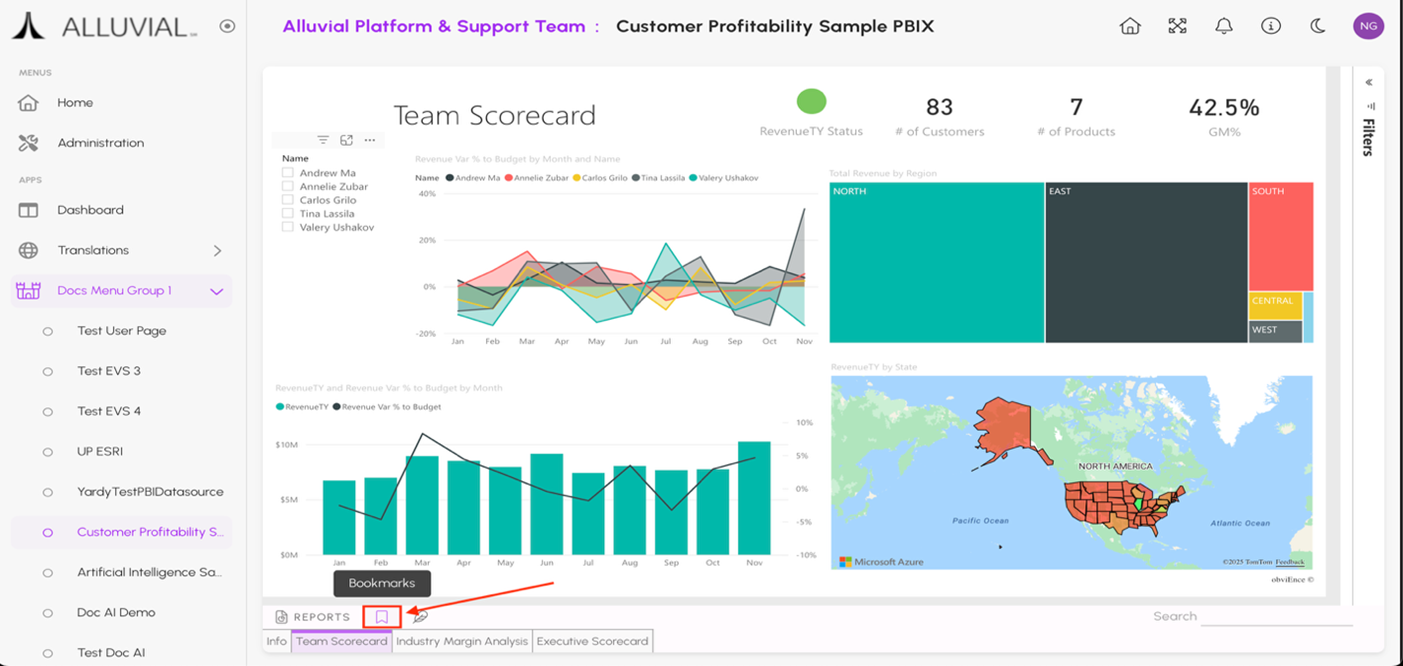
When you first open a report, you’ll see all bookmarks that were created in Power BI Desktop. Click the BOOKMARKS button at the bottom left of the report to view them.
Capture a Bookmark
Capturing a bookmark saves the current state of your report, including any filters, slicers, or visual interactions you’ve applied.
To capture a report interaction as a bookmark:
- Open the report in Alluvial.
- Open the Bookmarks option to display the bookmark controls.
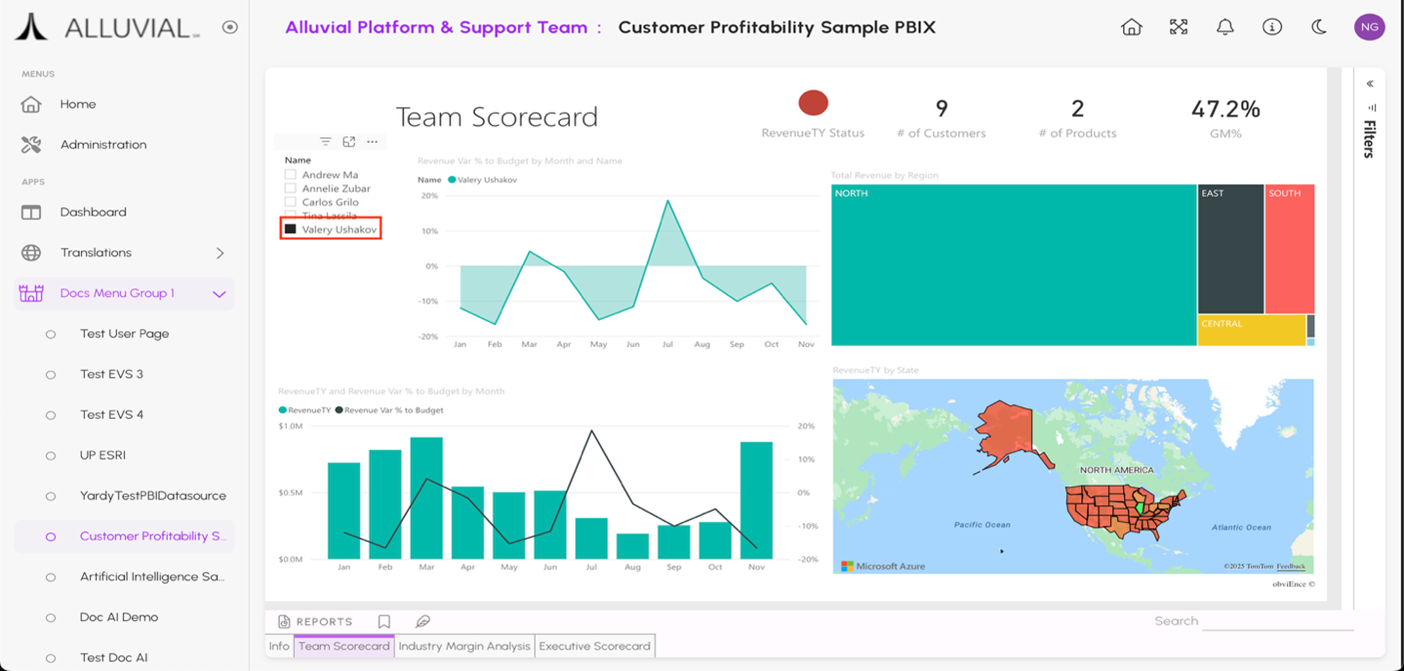
- Navigate to the desired report state by interacting with visuals (e.g., applying filters, changing slicer values, or drilling into data).
- Click the Capture Bookmark button at the bottom of the report.
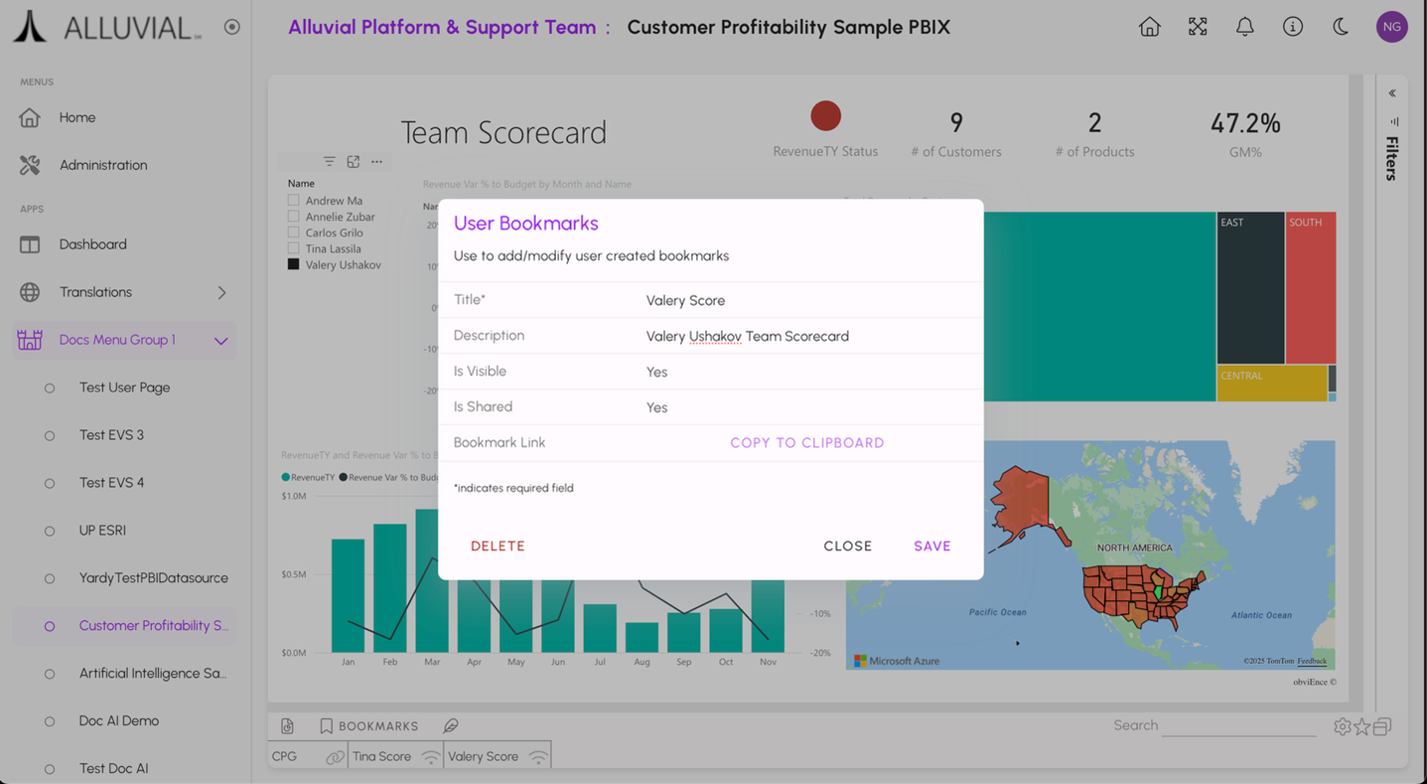
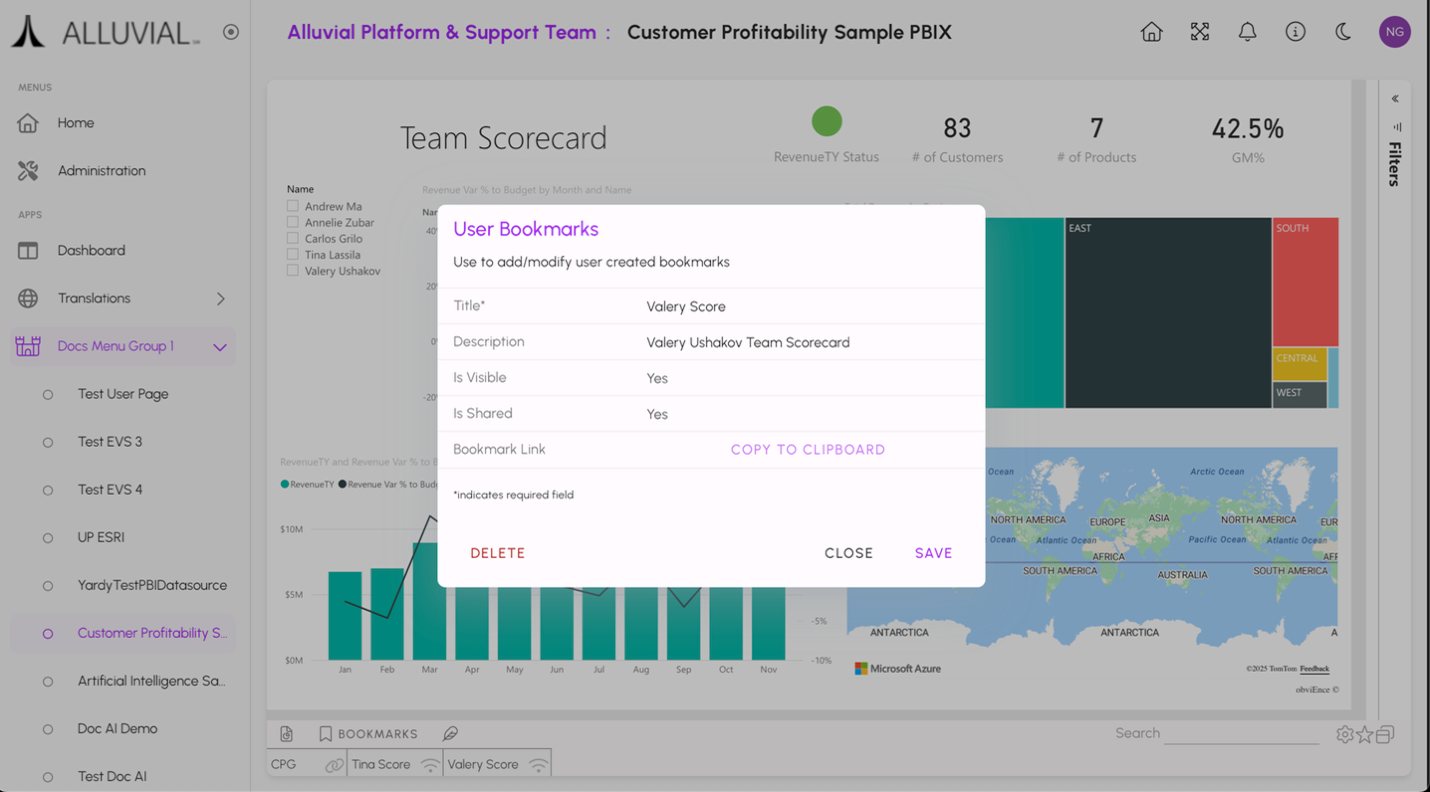
- In the User Bookmarks dialog, complete the following fields:
- Title – A descriptive name for your bookmark
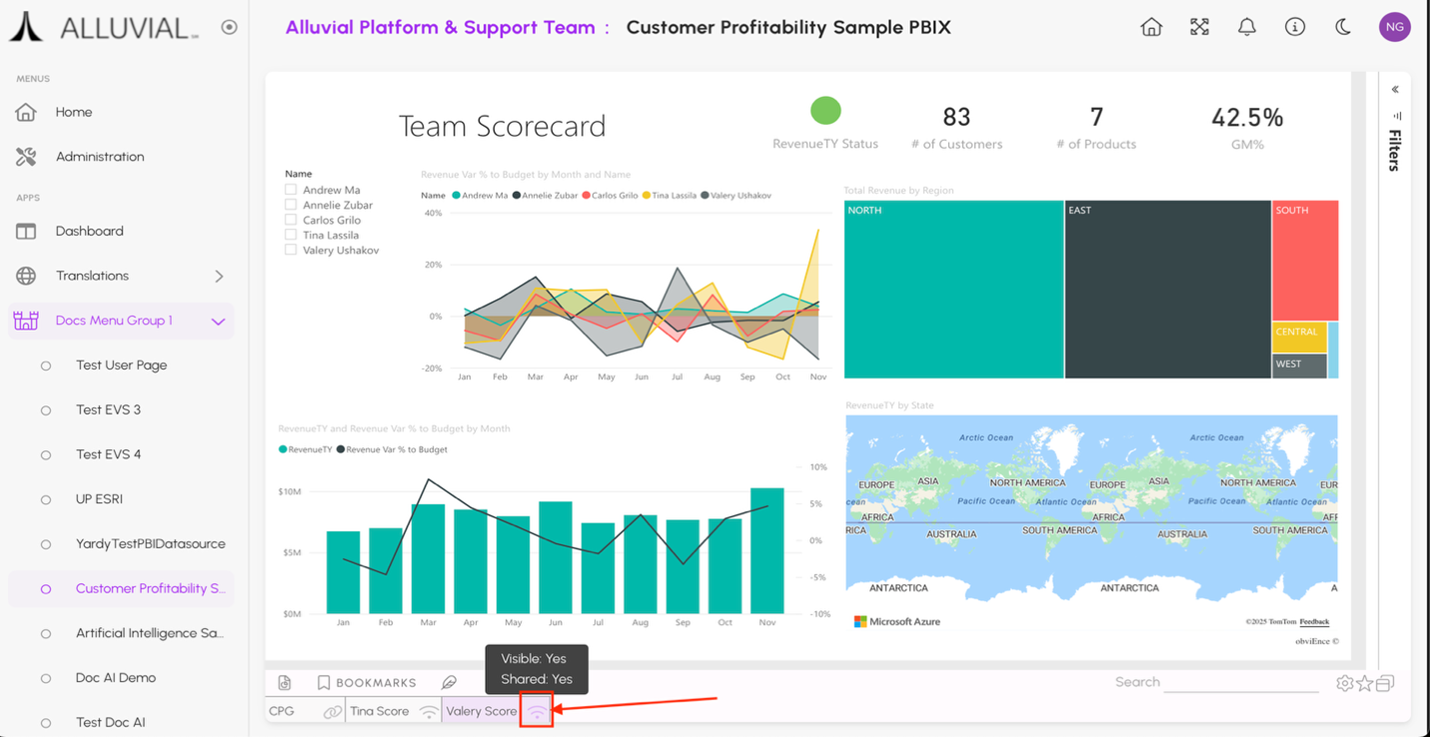
- Description – Additional context that appears when hovering over the bookmark in your report
- Is Visible – Toggle whether the bookmark appears in the bookmark list (set to “No” to hide from view)
- Is Shared – Toggle whether other users can access this bookmark (set to “Yes” to share with team members)
- Bookmark Link – Click CLICK TO GENERATE to create a shareable URL for your bookmark
- Click SAVE to create the bookmark.
Manage Bookmarks
The Bookmarks Management panel provides a centralized location to view, edit, and organize all bookmarks associated with your published report.
Access Bookmark Management
- Click Go to bookmarks management at the bottom of the report.
- The Custom Bookmarks Management page opens.
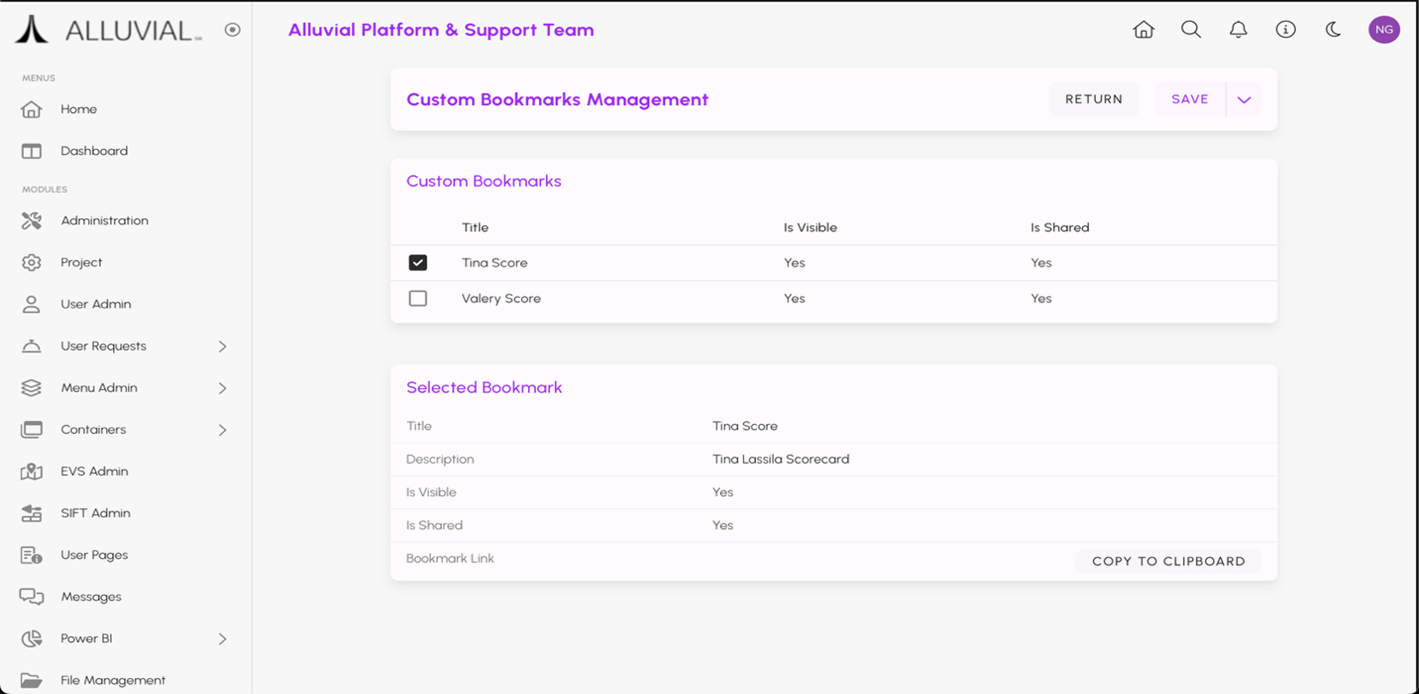
- You’ll see two main sections:
- Custom Bookmarks – A table listing all bookmarks with their settings
- Selected Bookmark – Details panel showing the currently selected bookmark
Edit a Bookmark
- In the Bookmarks Management panel, click the checkbox for any bookmark to open its details.
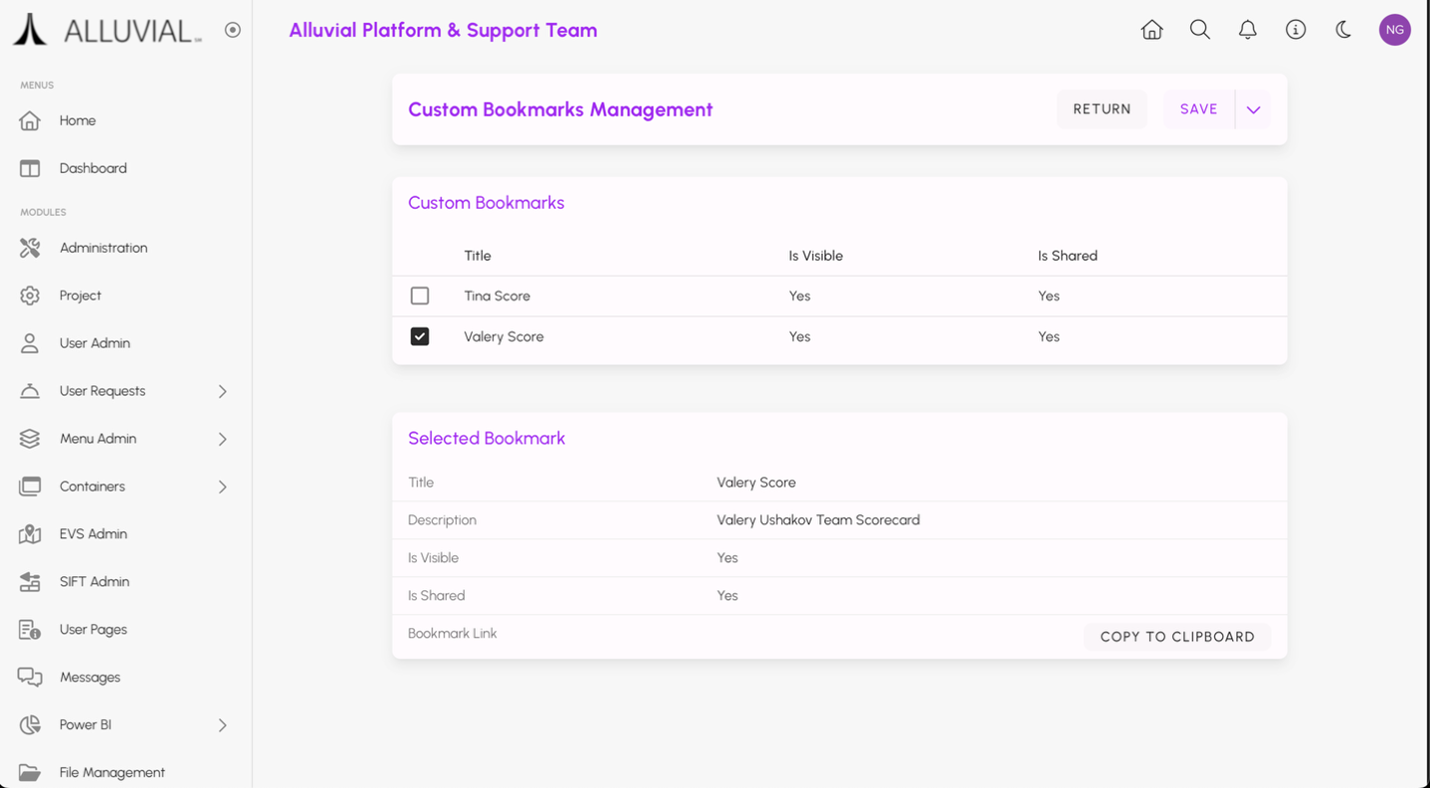
- Modify any of the following:
- Title – Update to a more descriptive or current name
- Description – Add, remove, or update the hover text
- Is Visible – Toggle visibility on or off
- Is Shared – Change sharing permissions
- Bookmark Link – Copy the bookmark link
- Click SAVE to apply changes, or RETURN to cancel.
IMPORTANT: Changes take effect immediately. If you change sharing settings, users will gain or lose access accordingly.
Delete a Bookmark
Deleting a bookmark permanently removes it from Alluvial. This action cannot be undone and affects all users who have access to the bookmark.
Steps to Delete a Bookmark:
- Click the bookmark edit icon.
- The User Bookmarks panel displays the bookmark details.
- Look for the DELETE option.
- Click the DELETE button to delete the bookmark.
Clear a Bookmark
The Clear Bookmark function removes all applied filters and settings, returning the report to its default state. This is useful when you want to start fresh and return to the original state of your published Power BI report.
When to Clear Bookmarks
- You’ve applied multiple bookmarks and want to return to the original report view.
- You want to see unfiltered data after exploring specific bookmark views.
- You need to reset cross-filter selections that were part of a bookmark.
Steps to Clear a Bookmark
- Click the Clear Bookmark button at the bottom of the report (eraser icon).
- The report immediately resets to its default state.
- Page-level and report-level filters defined in Power BI Desktop or Power BI Service before hosting the report on Alluvial remain active.
IMPORTANT: Clearing a bookmark does not delete it. The bookmark remains available in your bookmarks list and can be accessed at any time.
Power BI Data Source Settings
Power BI Data Source Settings allow users to manage the connections to the data sources used in their reports and dashboards. These settings control how Power BI connects to various data sources, including authentication methods, permissions, and configuration options to ensure secure and efficient data retrieval.
Properly configuring these settings is essential for maintaining data integrity, optimizing performance, and complying with security standards.
IMPORTANT: This portion of the document covers a topic related to Microsoft Power BI functionality. As such, it is outside the control of Alluvial and may become outdated without notice. The goal is to help you understand the process and common troubleshooting methods. For the most current information, refer to the official Microsoft Power BI documentation.
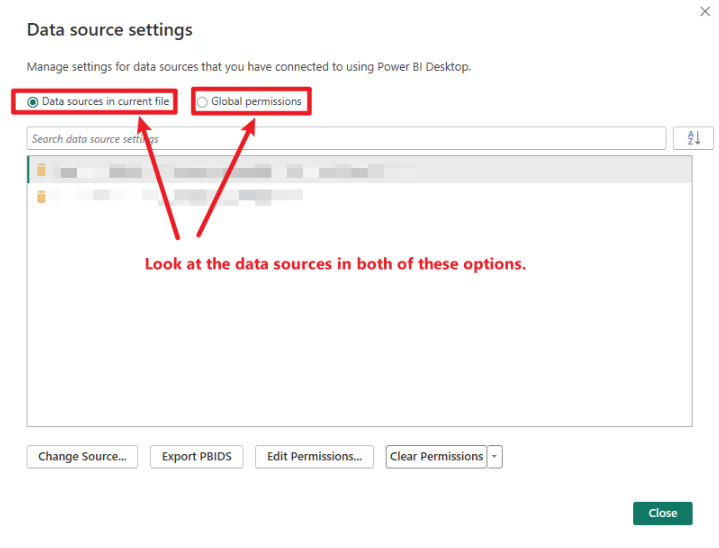
Modify Data Source Settings
There are several reasons why you might need to update your Power BI data source settings:
- Update Credentials: When authentication credentials expire or change.
- Change Data Source Location: If the source moves to a new server, database, or file path.
- Switch Authentication Method: To comply with policy changes or improve security.
- Enable Privacy Levels: For data protection and to avoid unintended data merges.
- Optimize Performance: Through query folding, caching, or similar adjustments.
- Standardize Across Environments: Useful for dev/staging/production workflows.
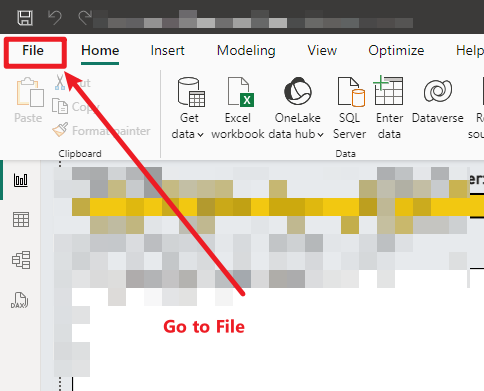
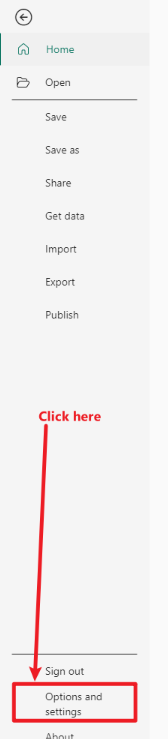
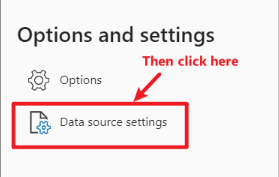
If any of these apply, follow the step-by-step screenshots below to update your settings:
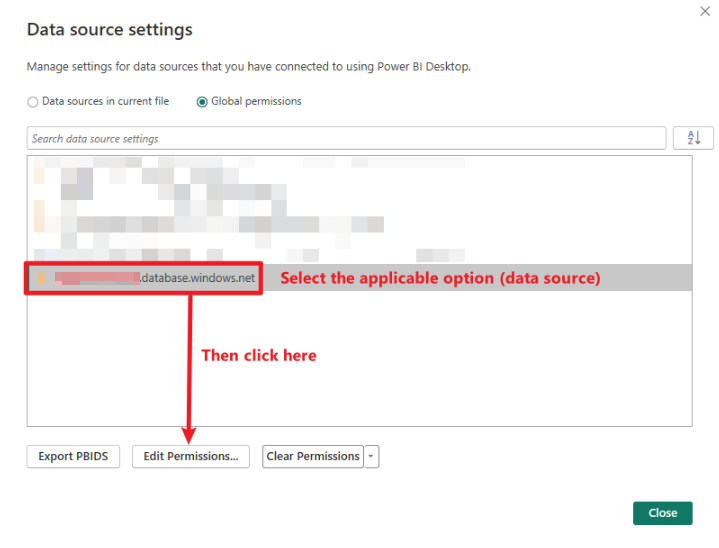
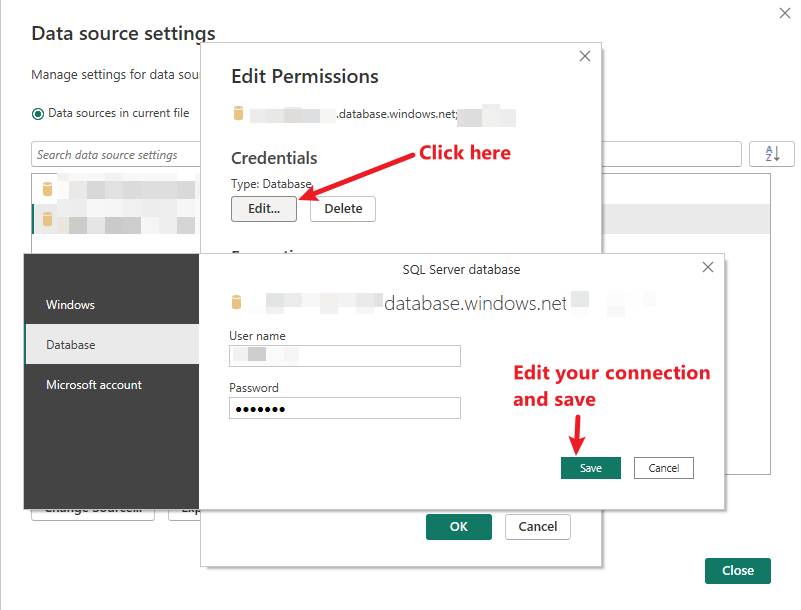
Alternatively, you can remove all saved connection permissions and re-enter them when prompted:
Power BI Paginated Reports
Power BI Paginated Reports are a specialized feature within the Power BI ecosystem. They’re designed to deliver pixel-perfect, highly formatted, and printable documents, making them ideal for invoices, financial statements, and operational reports.
To build these reports, you’ll use Power BI Report Builder, which provides the tools for advanced layout control and formatting.
Paginated Reports help transform insights into structured documents, supporting consistent communication and professional output for stakeholders. For examples, review the sample reports here or watch the video below:
Interested in building your own? Microsoft offers a helpful training module to get started.
Publish Your Report
Publishing a Paginated Report works much like publishing a standard Power BI report. Once your report is complete in Power BI Report Builder, publish it to the Power BI Service by uploading it to a workspace.
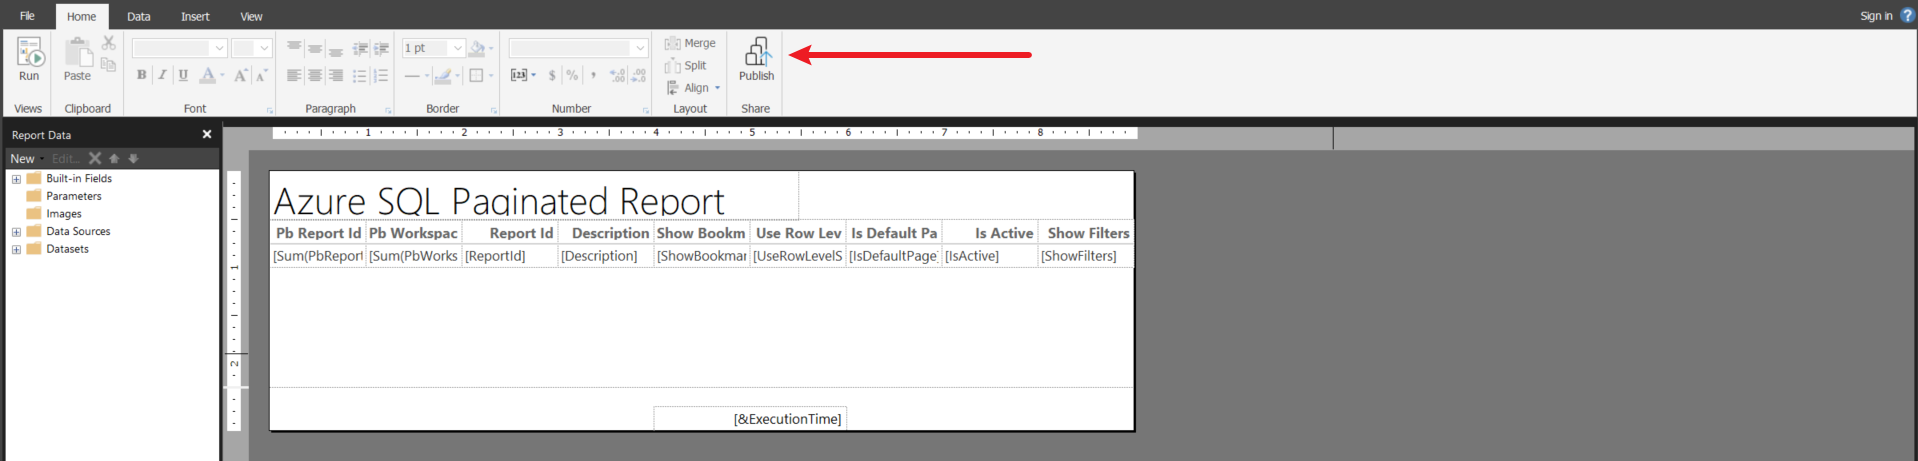
After publishing, you can share the report with your team using Alluvial, just as you would with a standard Power BI report.
Note that Paginated Reports are best for static, printable output. They're perfect for formal reporting needs, whereas standard Power BI reports are better for interactive data exploration. Both types are accessible via the Alluvial platform.
Embed Paginated Reports into Power BI Reports
Embedding Paginated Reports into standard Power BI reports allows you to combine the strengths of both formats. This integration provides a seamless experience for users who need access to both interactive dashboards and detailed, formatted documents.
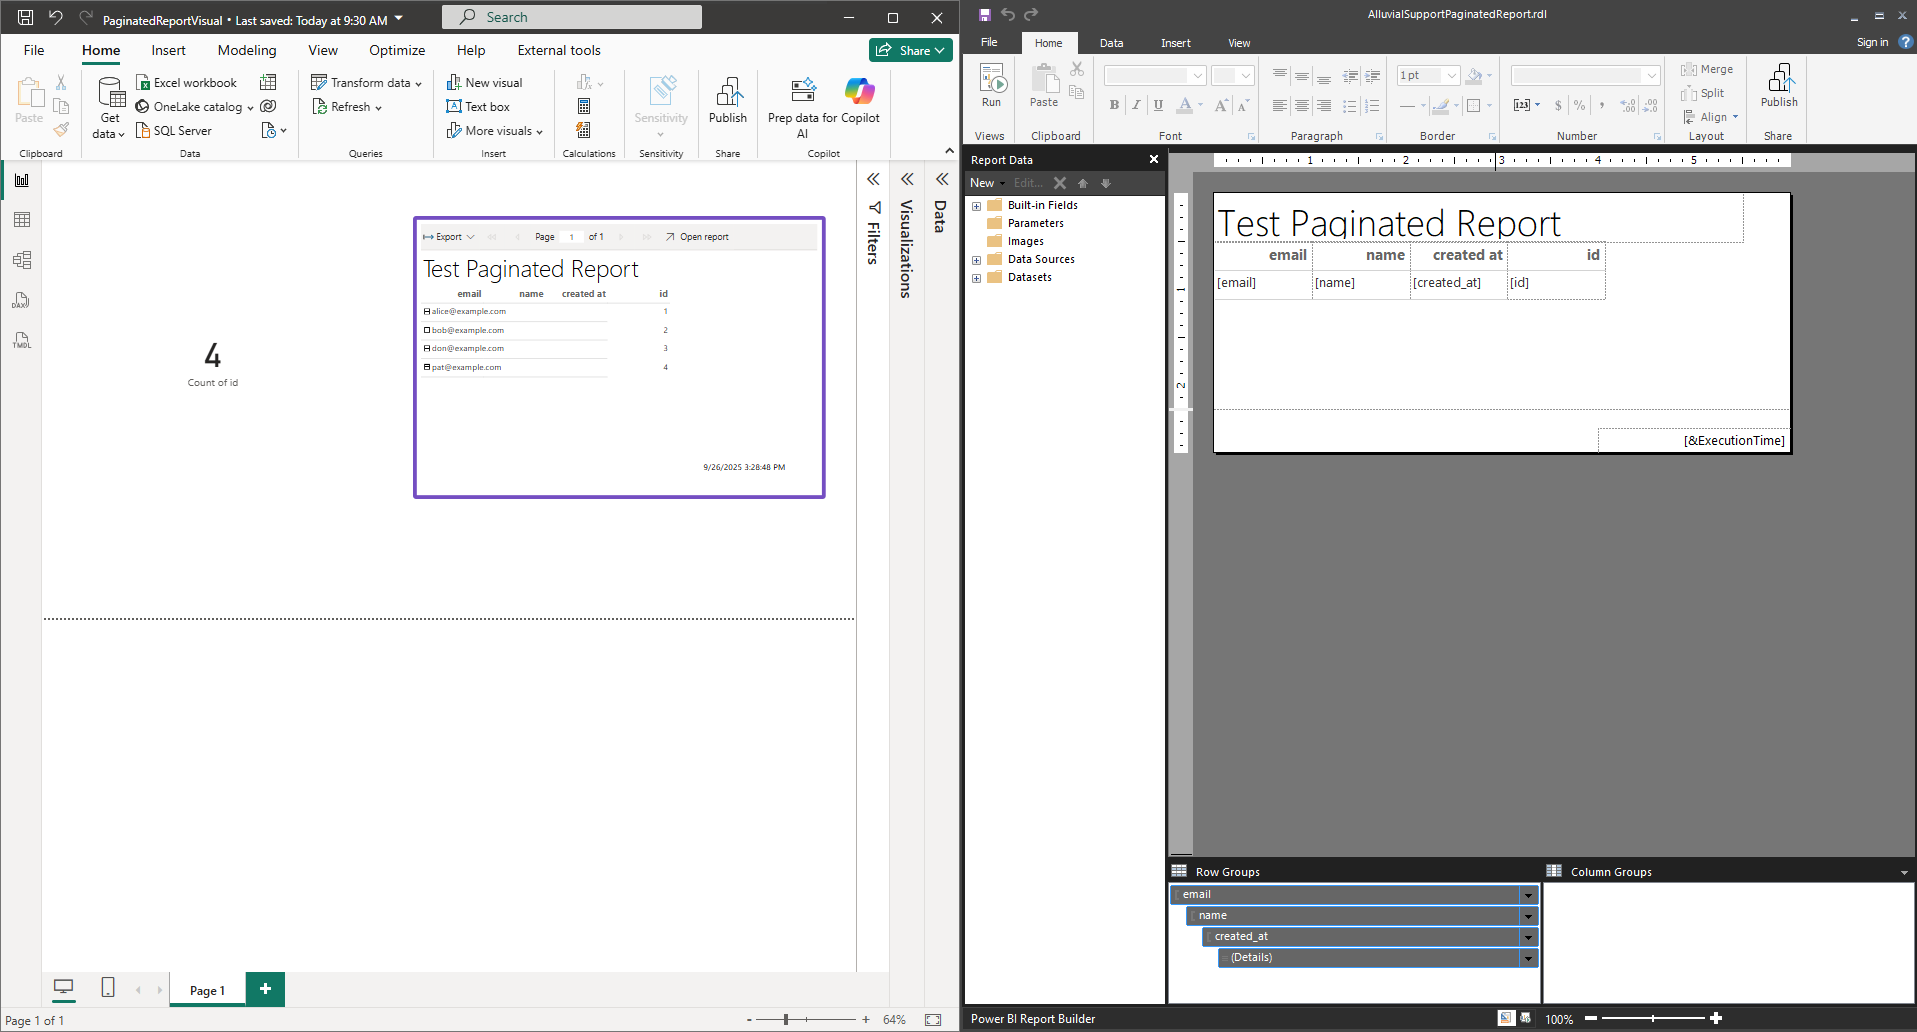
Using the paginated report visual in Power BI Desktop, you can embed Paginated Reports directly into your Power BI reports. The paginated report must be published to a Power BI workspace before it can be embedded.
If you want to display an embedded Paginated Report in Alluvial, ensure that the Power BI report containing the paginated visual is published to the same workspace connected to your Alluvial project. The paginated report should also be published to that same workspace.
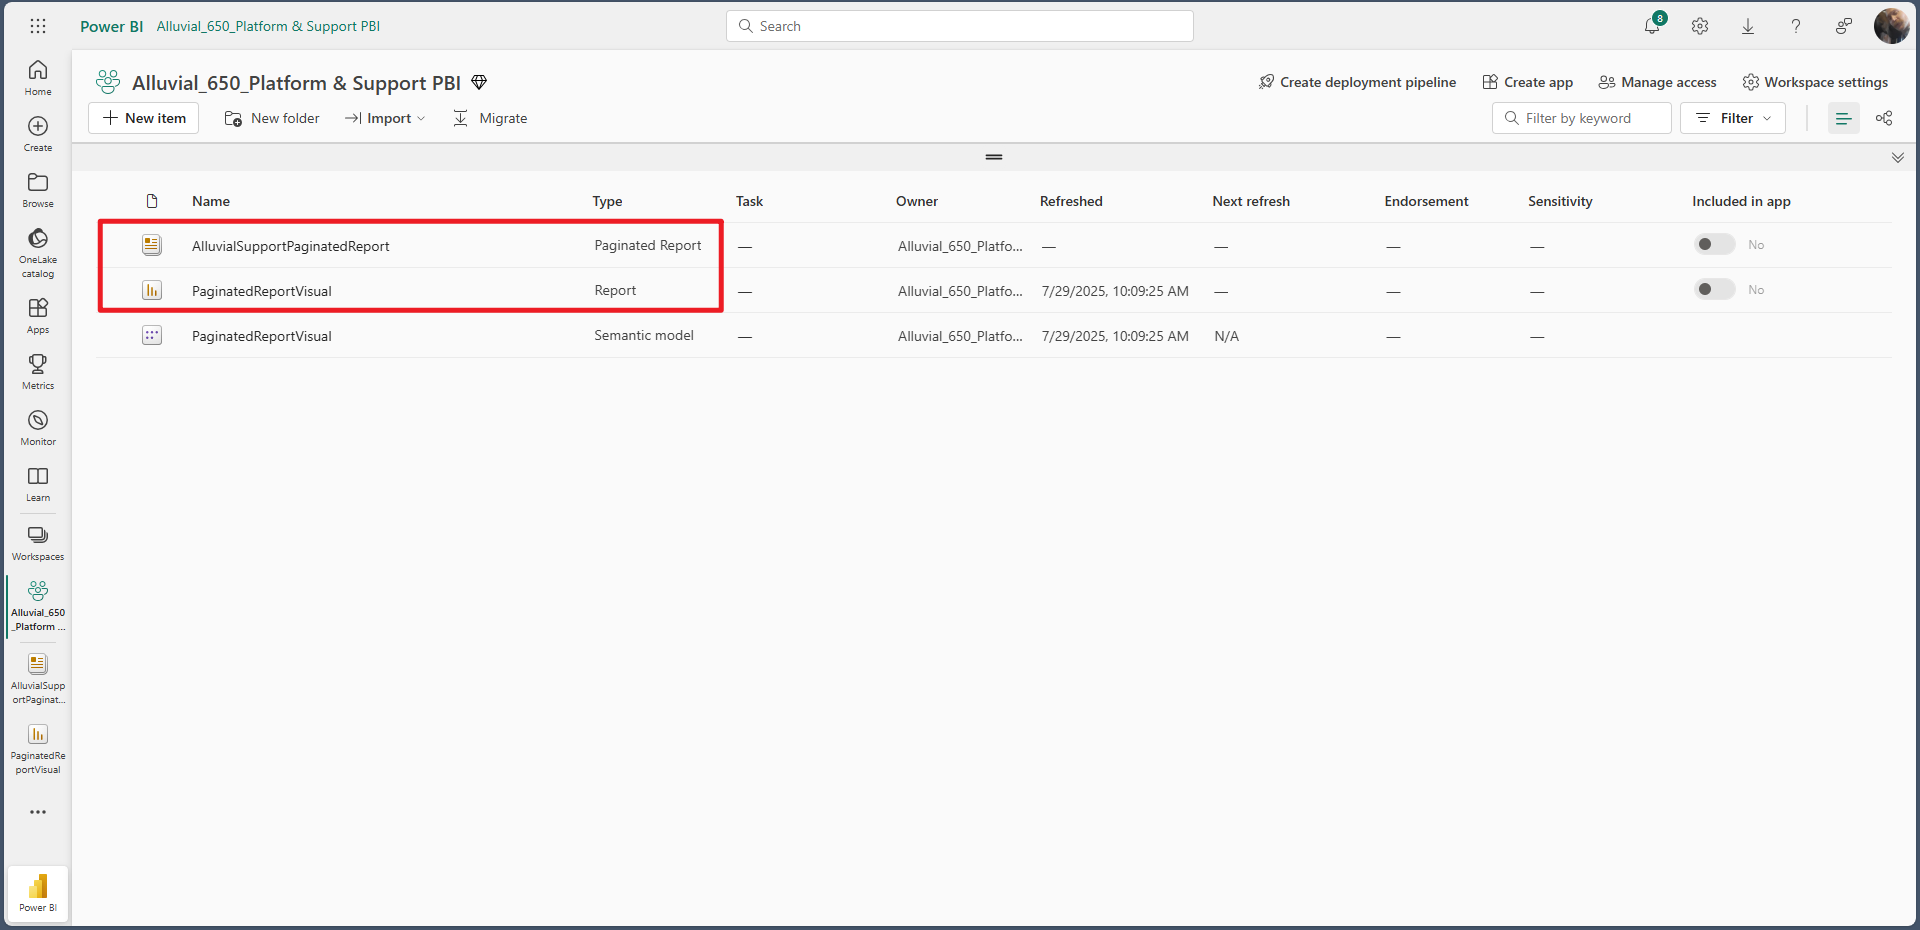
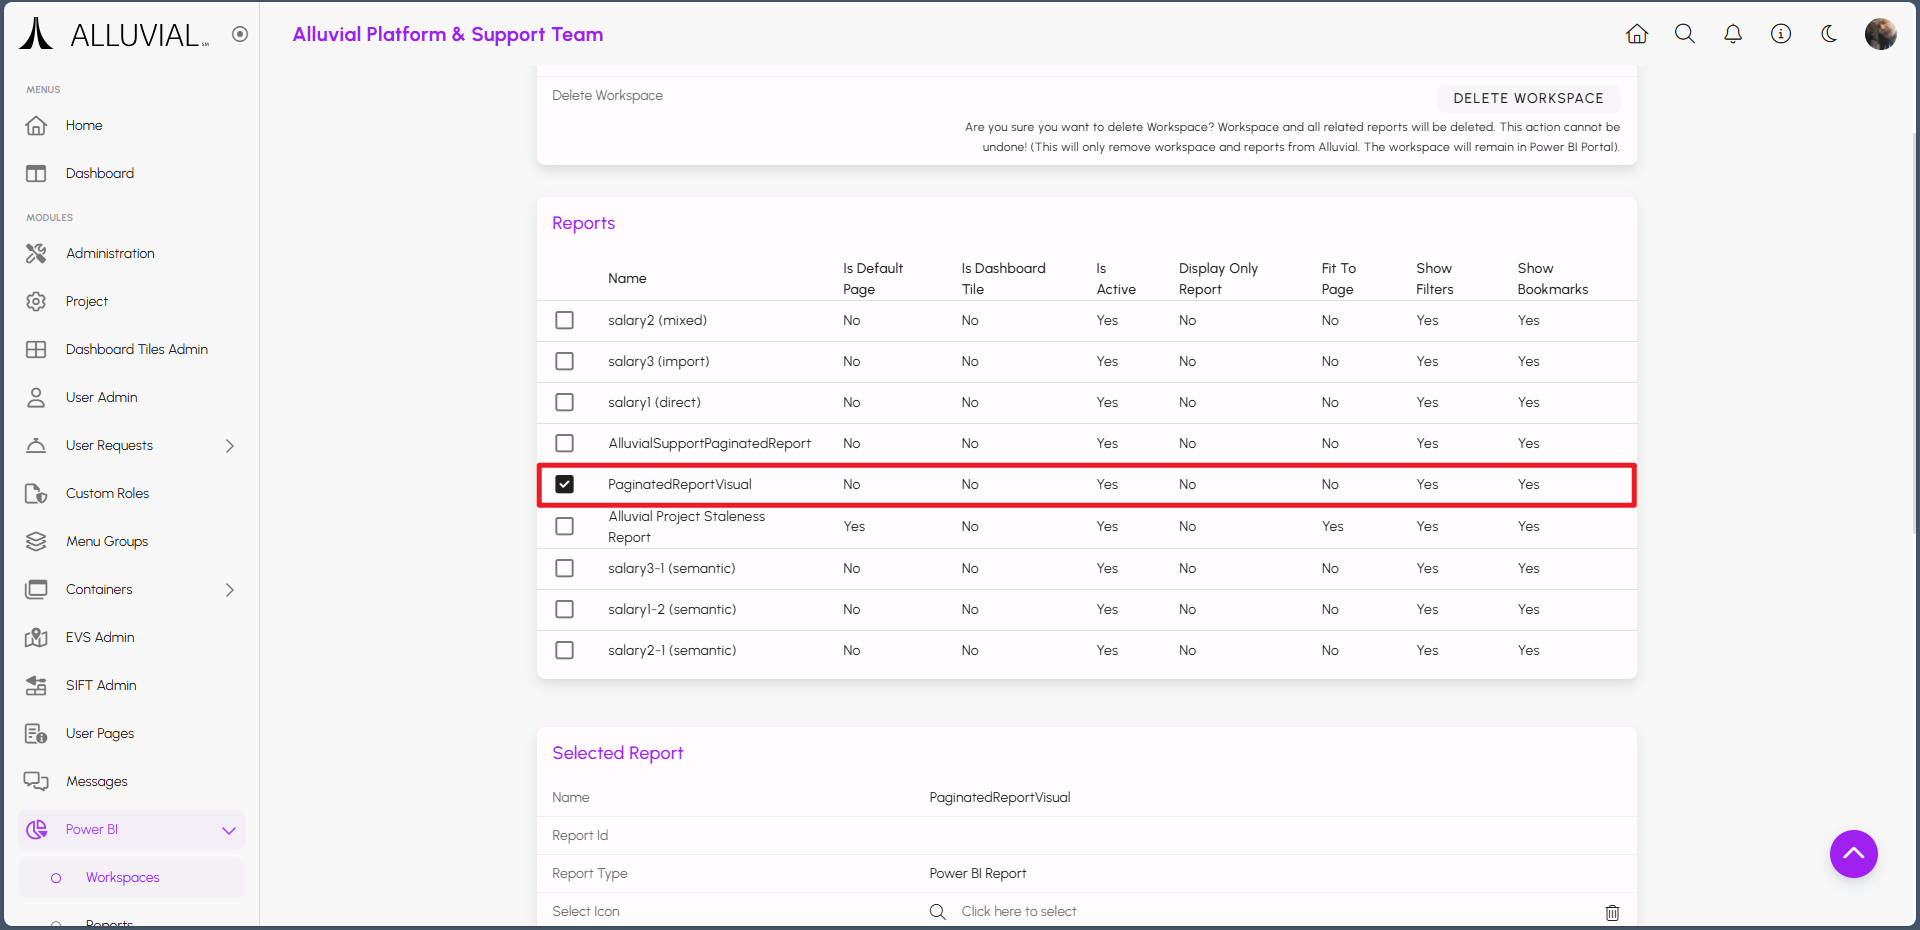
Once both reports are published to the same workspace, select the Power BI report containing the paginated visual in the Alluvial Power BI Workspaces & Reports module.
After selecting it, scroll down to the Selected Report section and click SELECT EMBEDDED PAGINATED REPORTS.
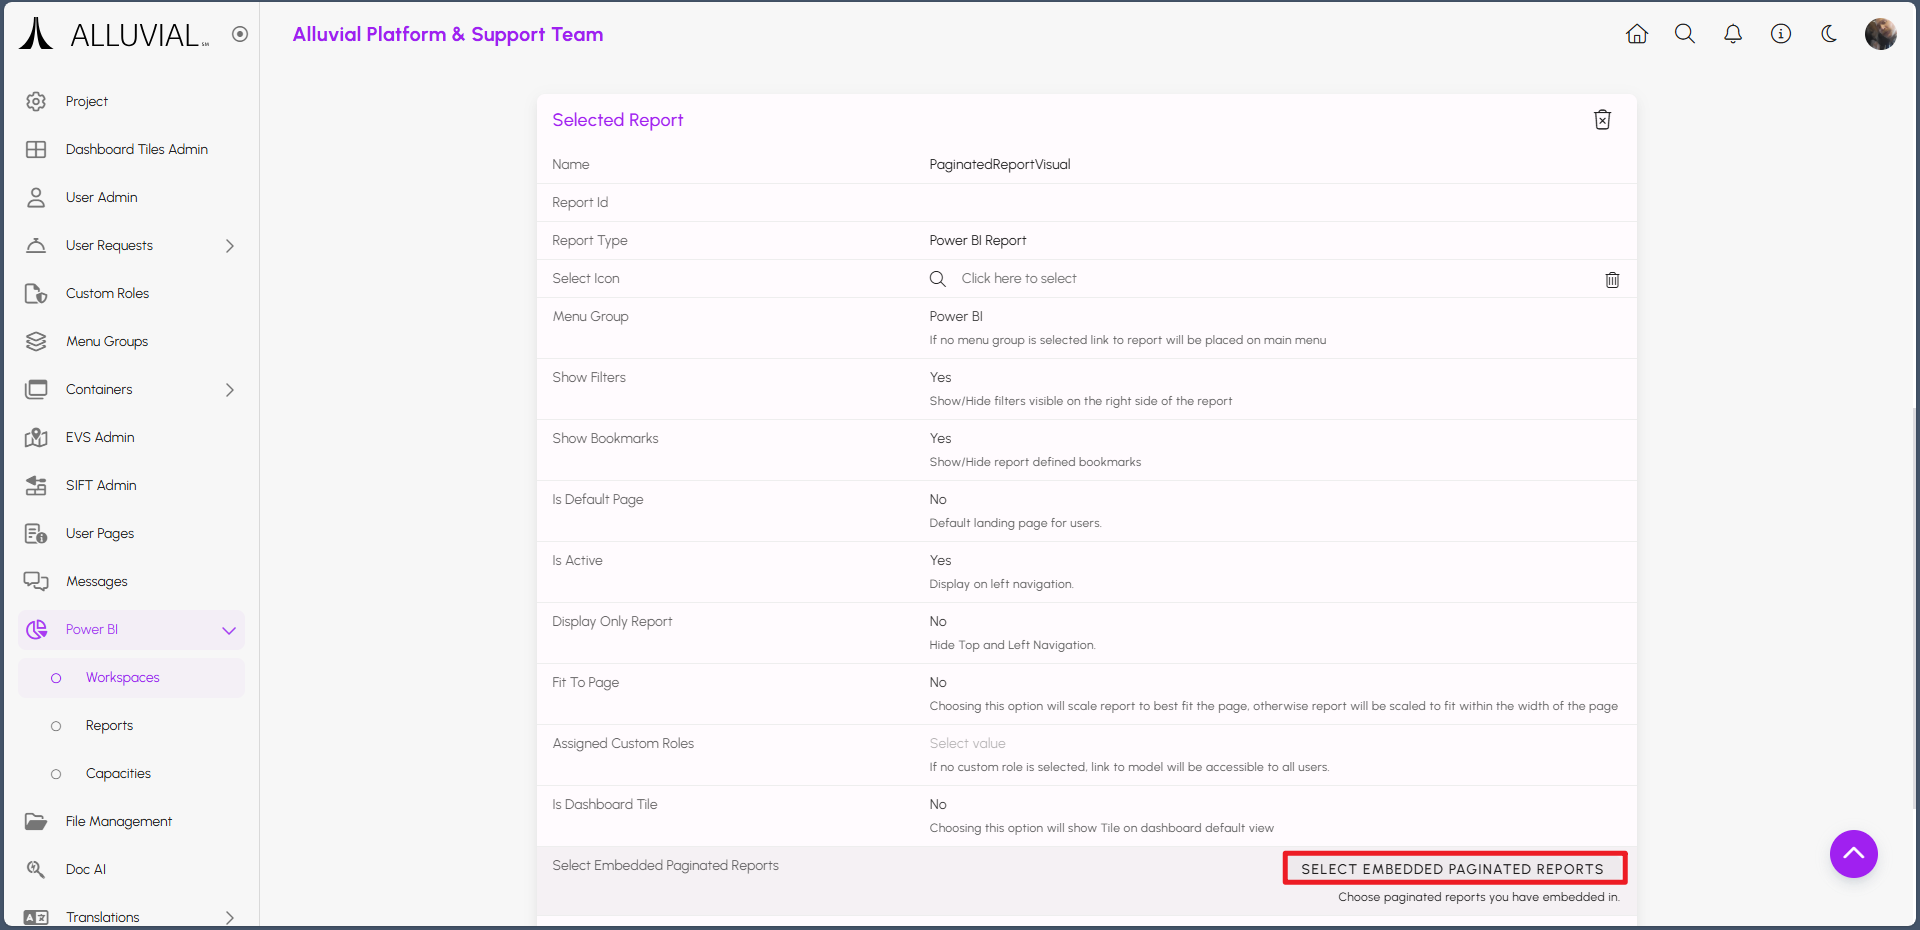
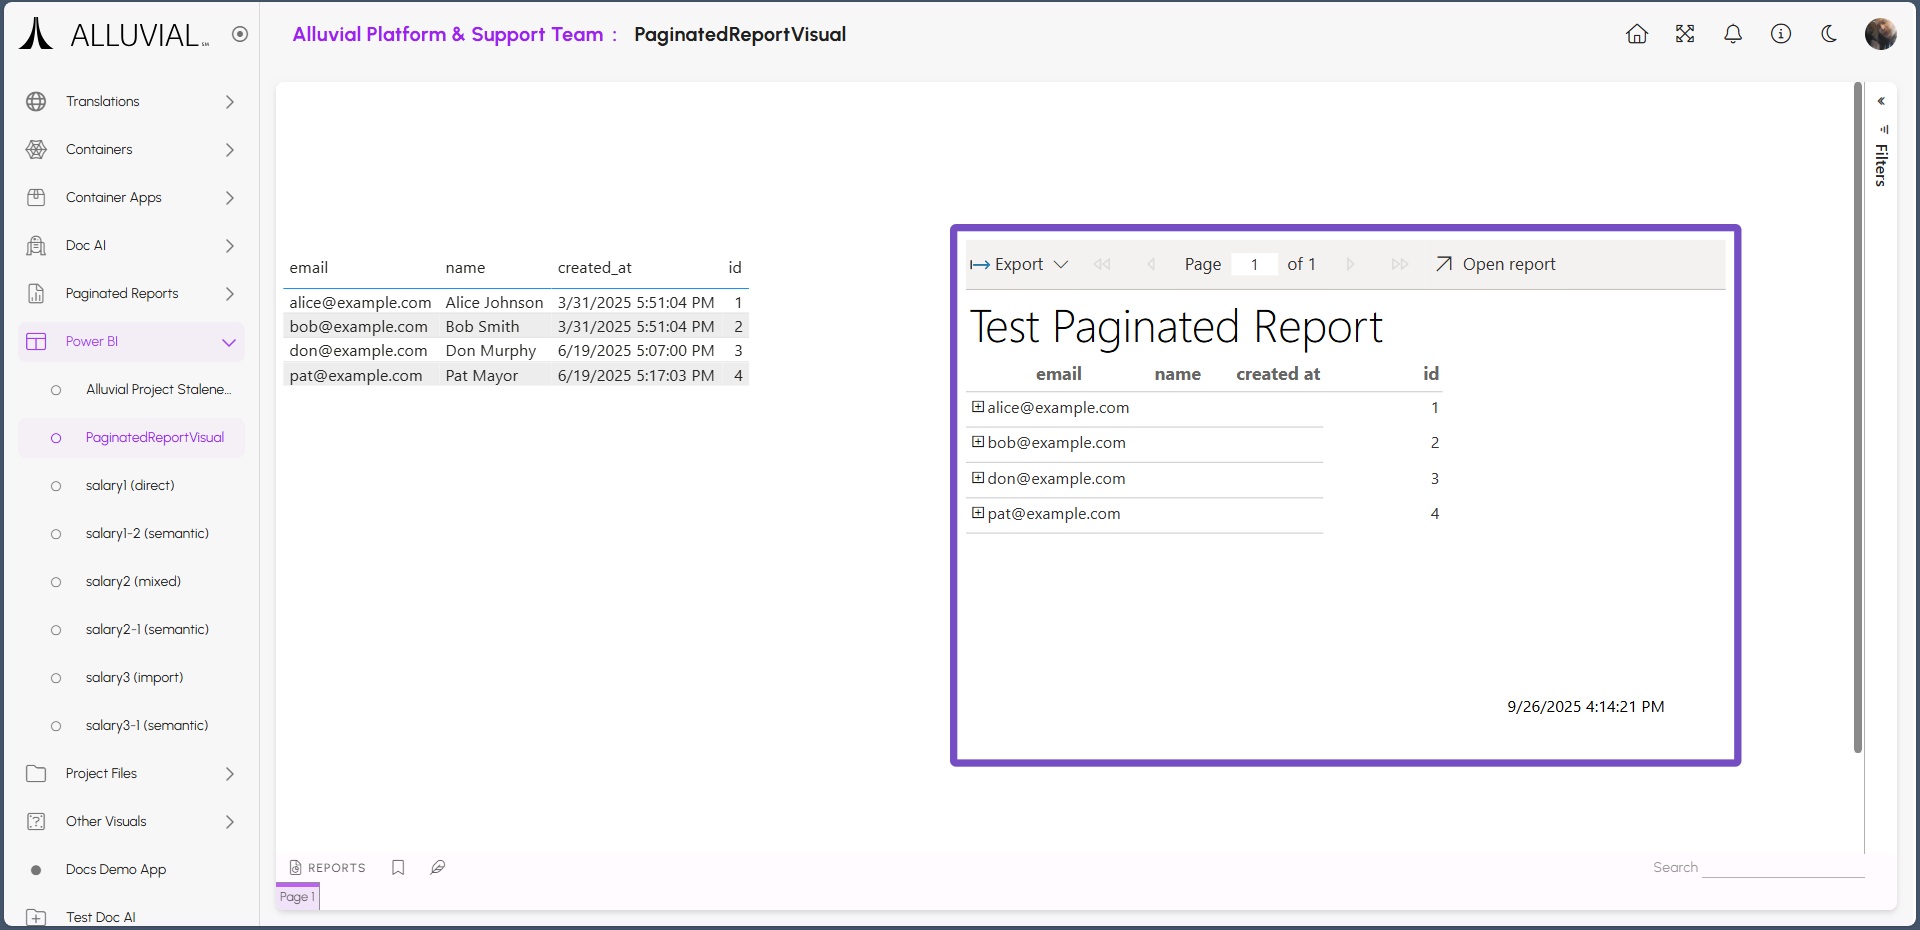
This opens a dialog where you can select the paginated report or reports to embed. After making your selections, click APPLY CHANGES and save the form.
When you open the Power BI report in Alluvial, the embedded paginated report appears inside the report.
Embedding Videos
Do you or your client have a video you want to share in your project, but would prefer not to upload it to public platforms like YouTube? If so, you can embed videos directly into your reports using secure storage solutions.
This section walks through embedding a video hosted in Azure Storage into a Power BI report. The process is similar for containerized applications, though the specific steps may differ.
To get started, you'll need:
- The video file (MP4, MOV, etc.)
- A cloud storage account (e.g., Azure, AWS)
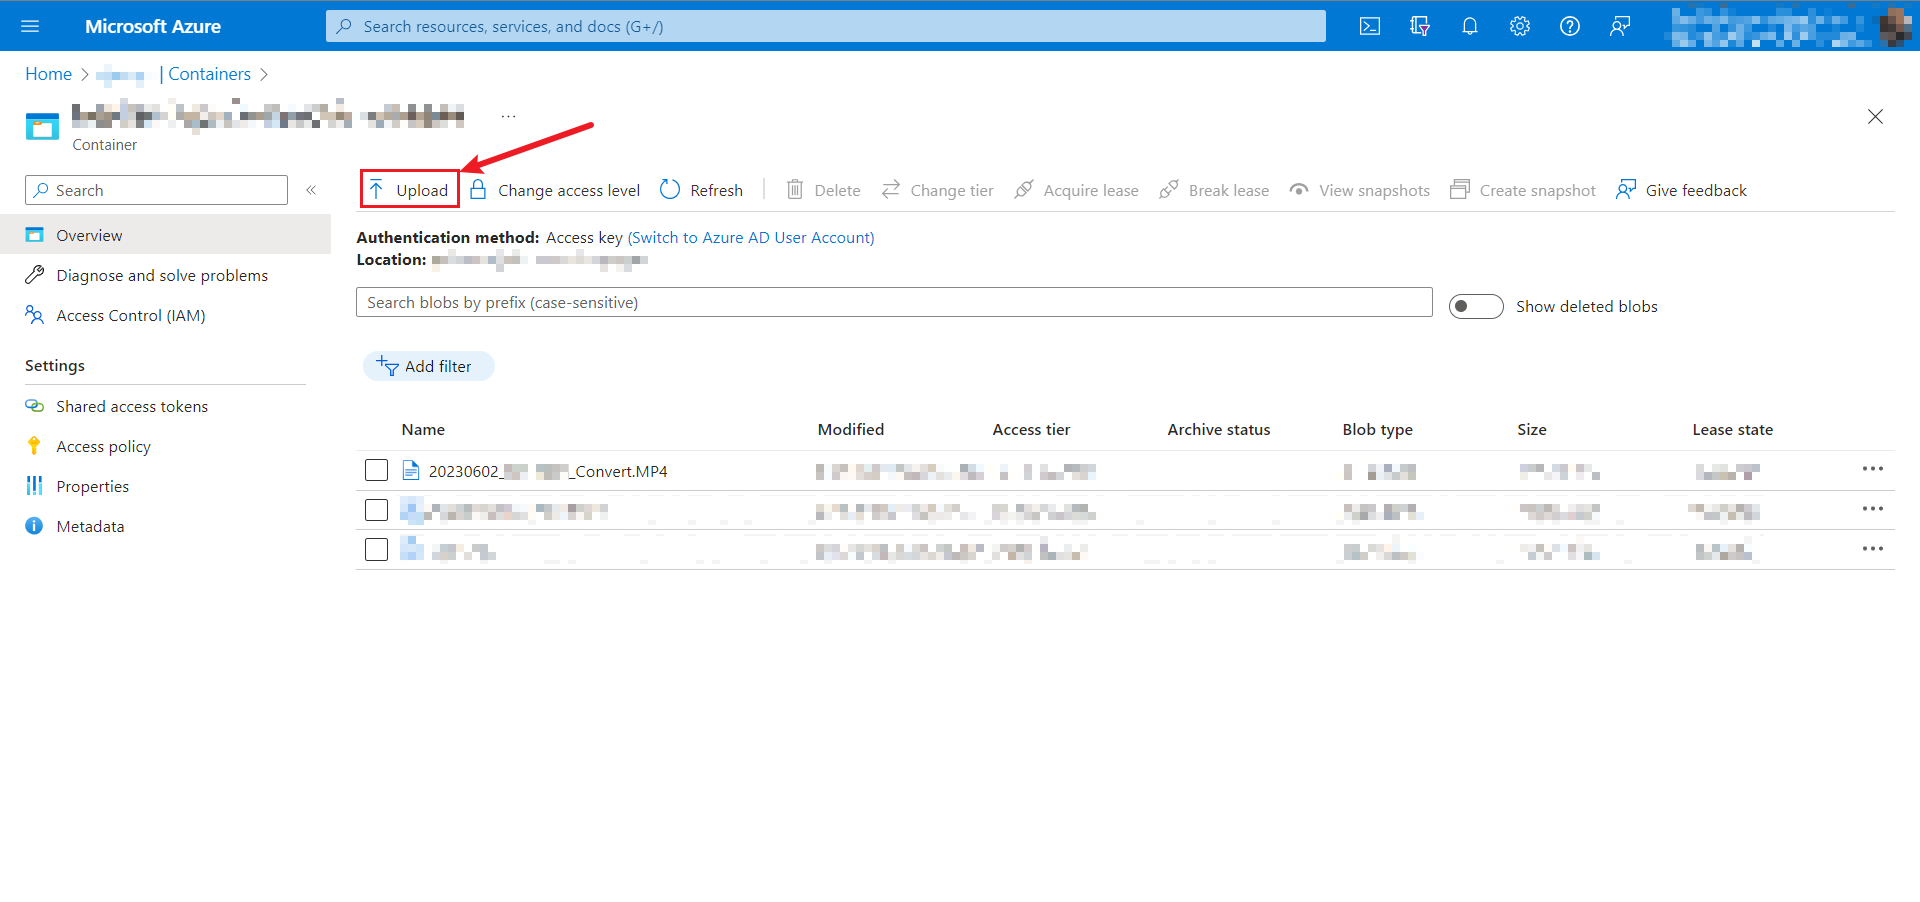
Upload Video to Azure Storage Account
Start by uploading your video file to an Azure Storage Account. If you don’t have one yet, follow this guide to create one. Then upload your video using these instructions.
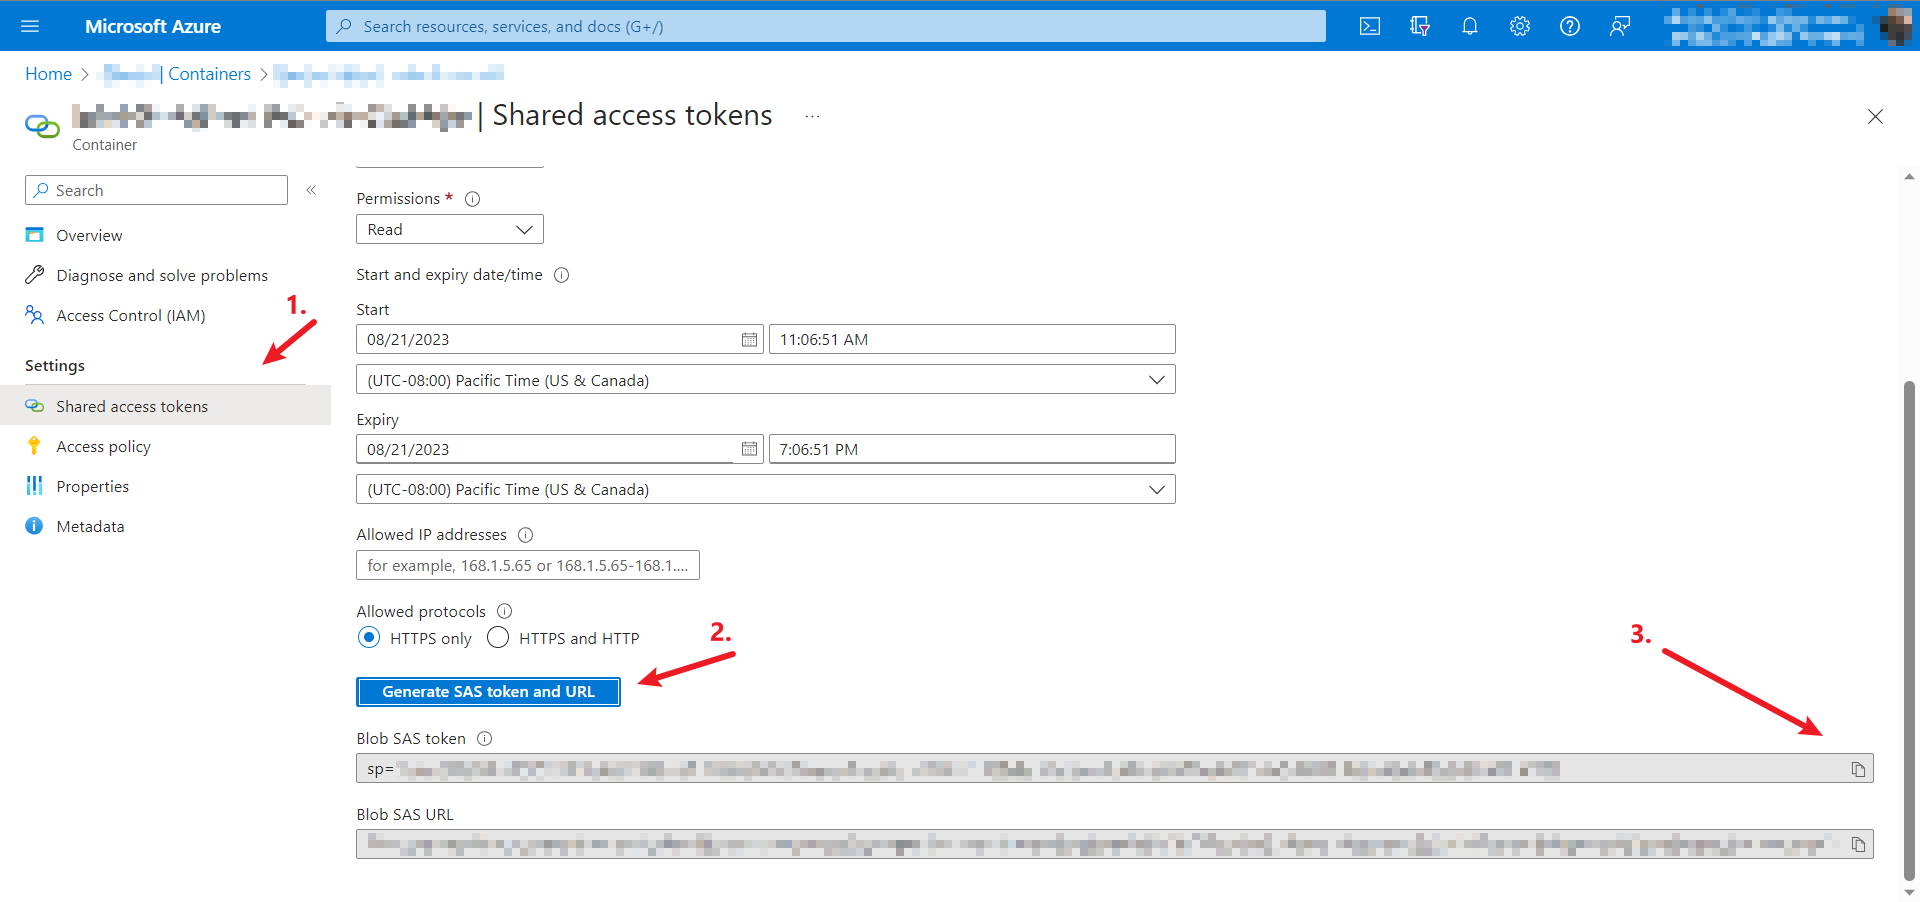
Get Video URL and SAS Token
Navigate to your video container in Azure, then select Shared Access Tokens from the sidebar.
IMPORTANT: Be sure to note the expiration date and update or replace the SAS token as required. Once it expires, the SAS token will block video playback.
Click Generate SAS Token and URL, then copy only the Blob SAS Token (not the full SAS URL).
*sp=r&st=2200-01-01T18:06:51Z&se=3100-12-31T00:00:02Z&spr=https&sv=2240-12-01&sr=c&sig=...*
Get the Container URL
In the same menu, scroll down to Properties and copy the container URL.
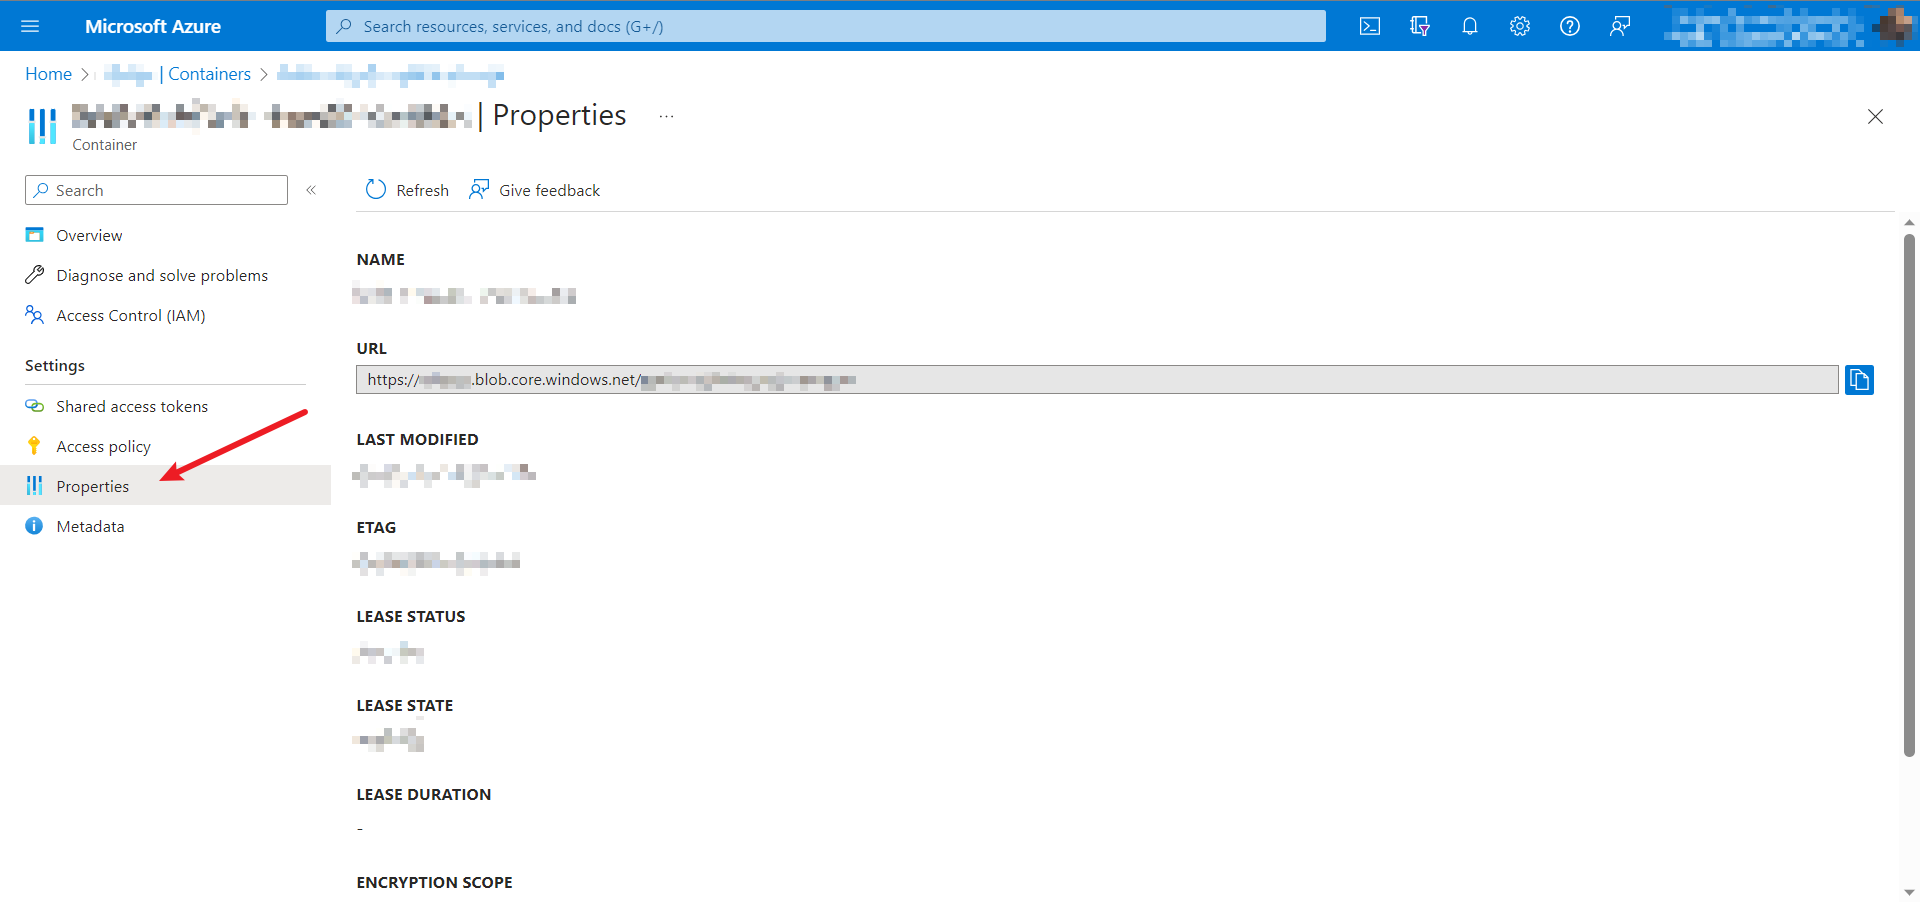
Build the Video URL
Combine your container URL with the SAS token and file name to create the final video link:
https://{YourURL}.blob.core.windows.net/{YourContainerName}/{YourVideoName}.{VideoExtension}?{YourSASToken}
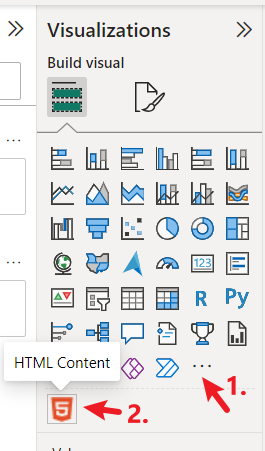
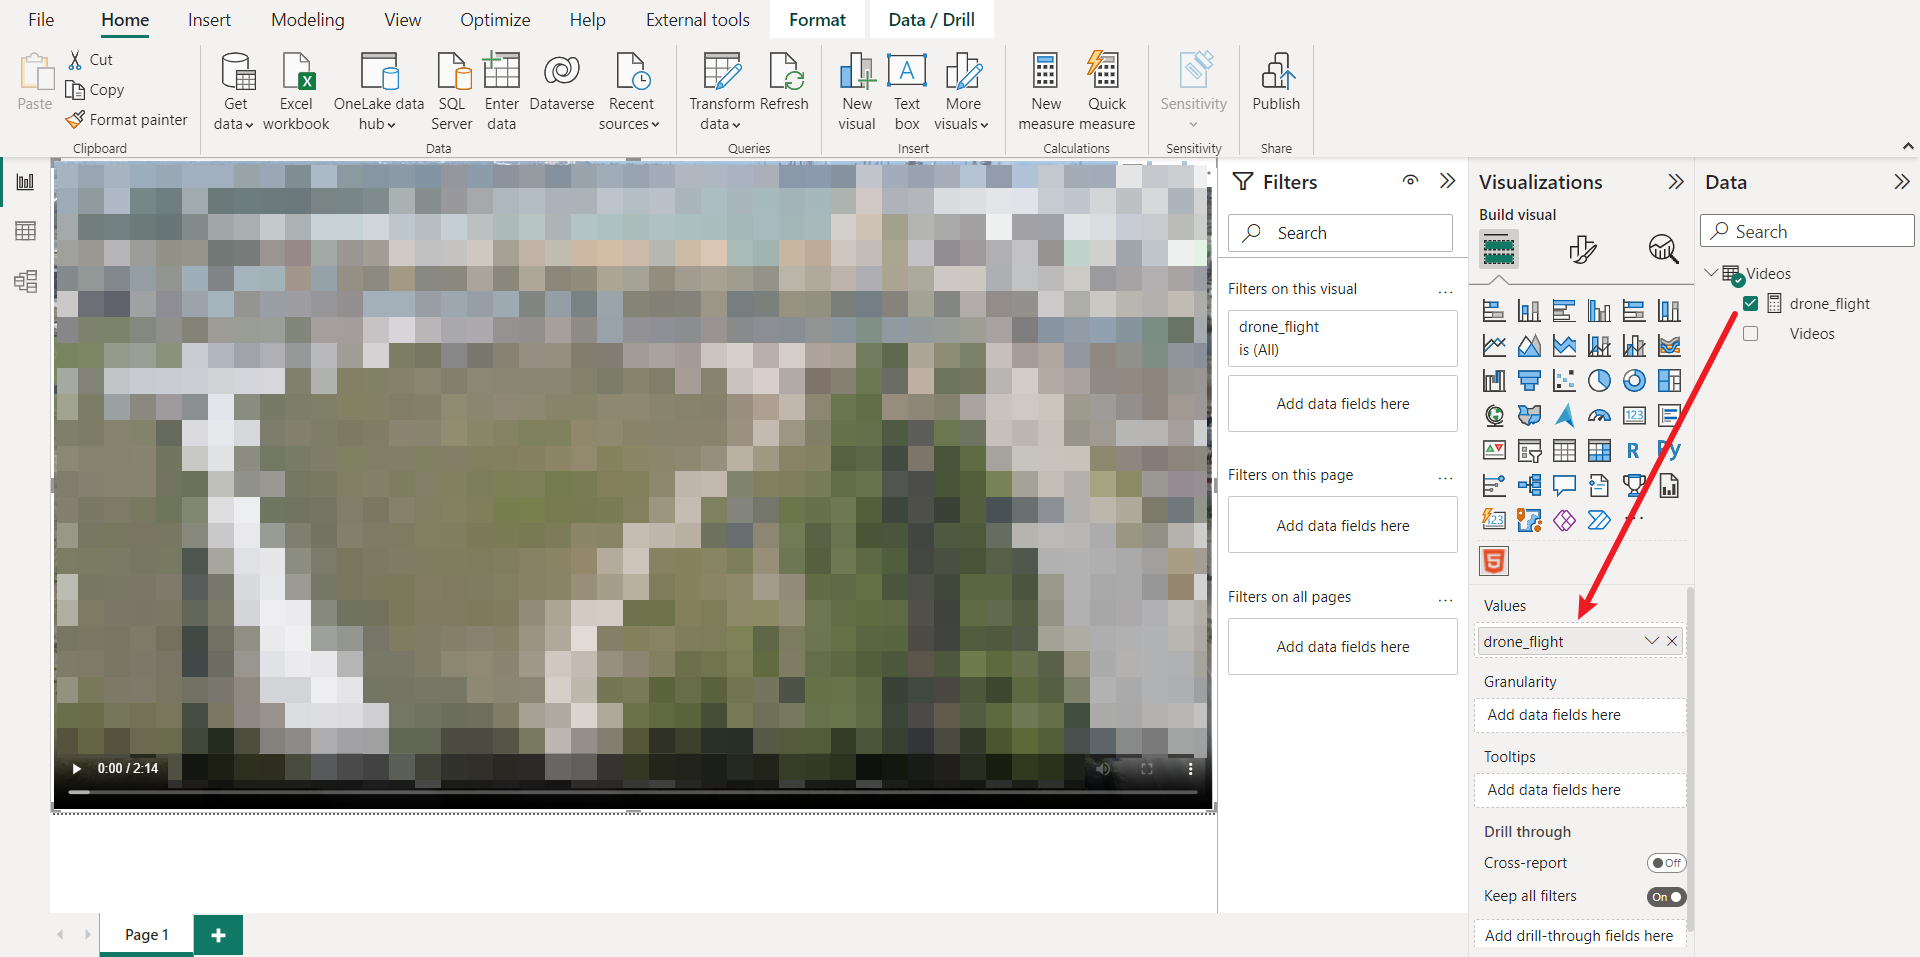
Embed into Power BI
Add the "HTML Content" visual to your Power BI report. Click the visual to add it.
Create a table containing the video URLs.
IMPORTANT: Each video URL should have its own row in the table.
In Power Query Editor, create a blank query and apply changes:
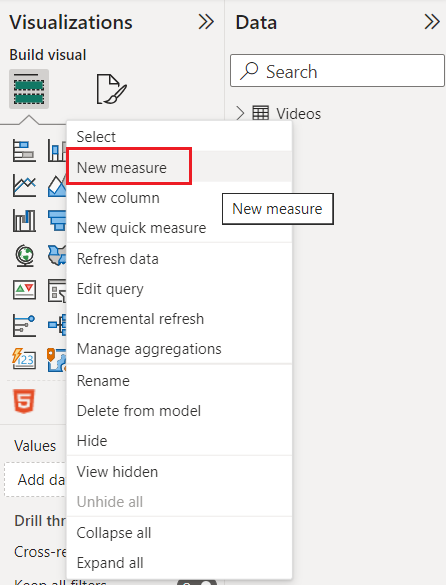
Right-click the table and select New Measure:
Define the measure using HTML and your combined video URL:
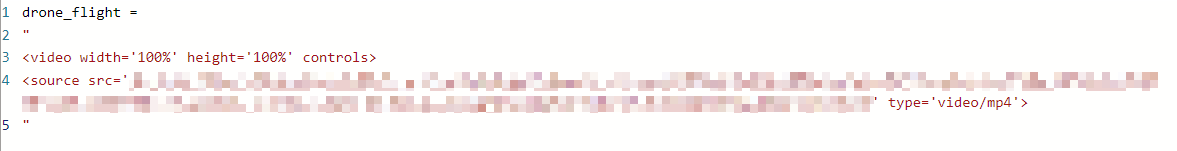
drone_flight =
"<video width='100%' height='100%' controls>
<source src='https://{YourURL}.blob.core.windows.net/{YourContainerName}/{YourVideoName}.{VideoExtension}?{YourSASToken}' type='video/mp4'>
"
Finally, add the visual to the report and assign the measure. Your video is now embedded.
Re-Encoding
If some users experience playback issues, try re-encoding the video using a tool like FFmpeg. Run the following command:
ffmpeg -y -i {your_video_file}.{file_extension} -movflags faststart {output_video_file_name}.MP4
-y: Overwrites existing files without confirmation.-i: Specifies the input file.-movflags faststart: Moves metadata to the front of the file so playback can begin before downloading completes.
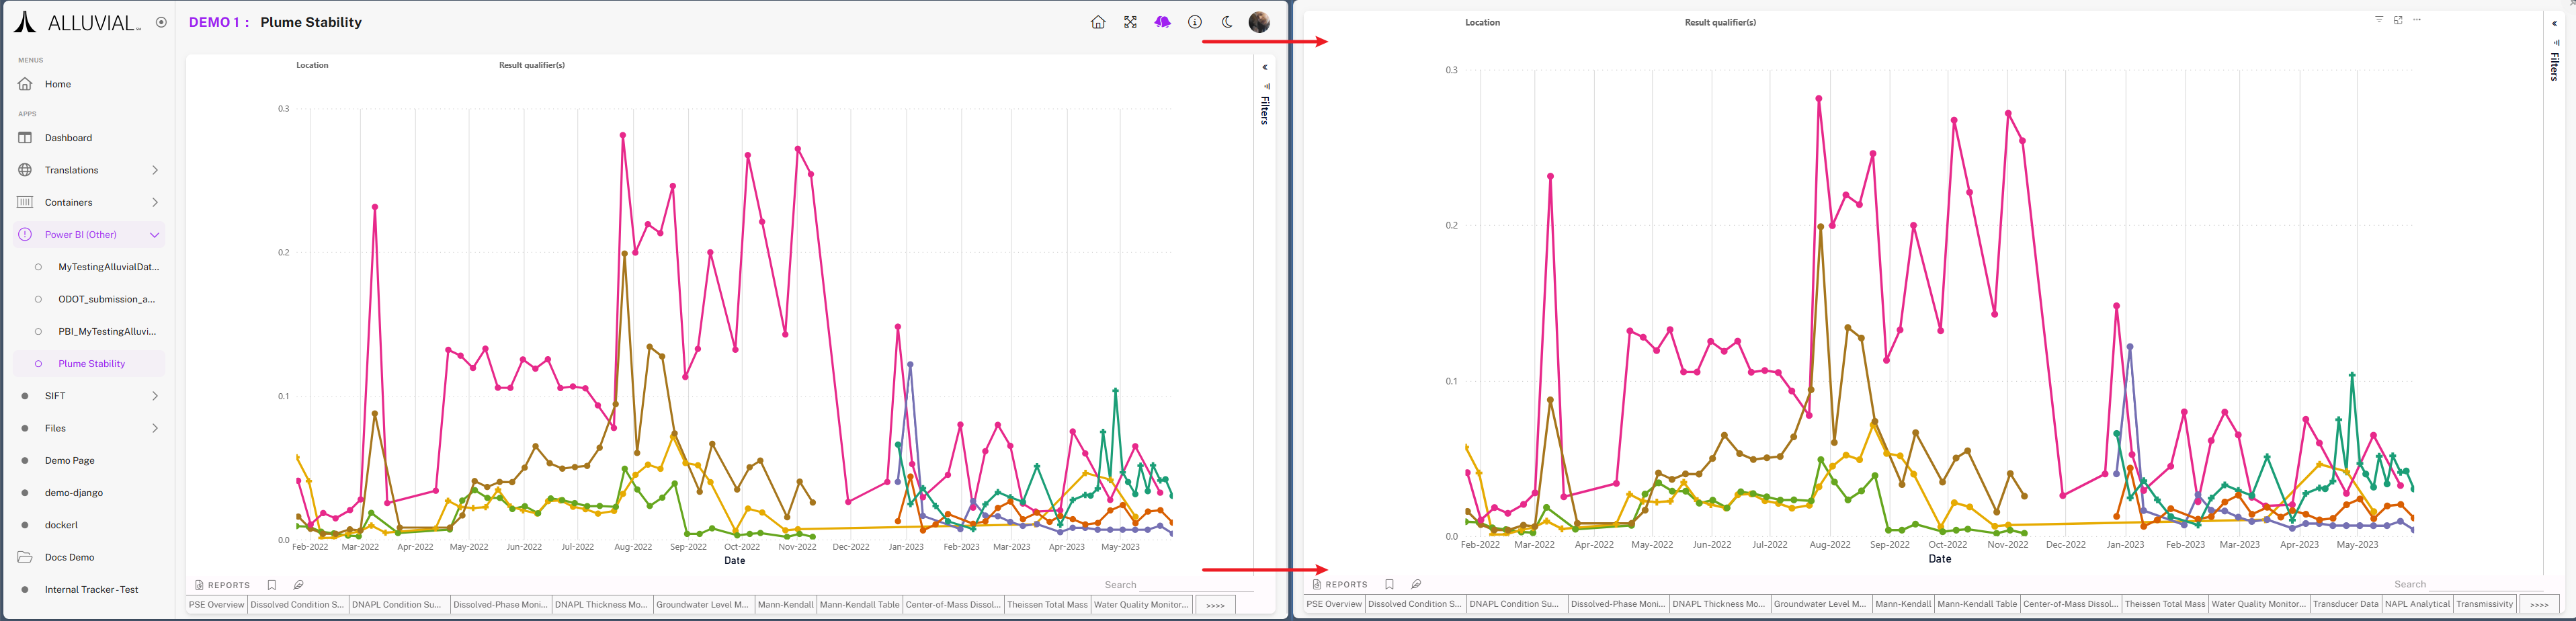
Full Window Mode
The Full Window feature offers a distraction-free view of Power BI reports for presentations, reviews, or stakeholder sessions.
You can enable Full Window mode in three ways:
- Full Window Query String Parameter
- Full Window Button
- Display Only Report (set when configuring the report on Alluvial)
Full Window Query String Parameter
Modify the report URL’s query string to launch in Full Window mode.
Example:
https://platform.alluvial.app/3/power-bi/reports/21/viewers?fullscreen=false
Change fullscreen=false to fullscreen=true:
https://platform.alluvial.app/3/power-bi/reports/21/viewers?fullscreen=true
Use this format when sharing links to ensure recipients see the report in a clean, full-window view.
IMPORTANT: Modifying the full window query string parameter is a manual effort. It is useful in scenarios when you want to send a user a link to the visual, without changing how the visual will be displayed for all other users.
Display Only Report
This option launches a designated report in Full Window mode by default when entering a project.
It is configured in the Workspaces & Reports section and is useful for creating a seamless, data-focused landing experience.
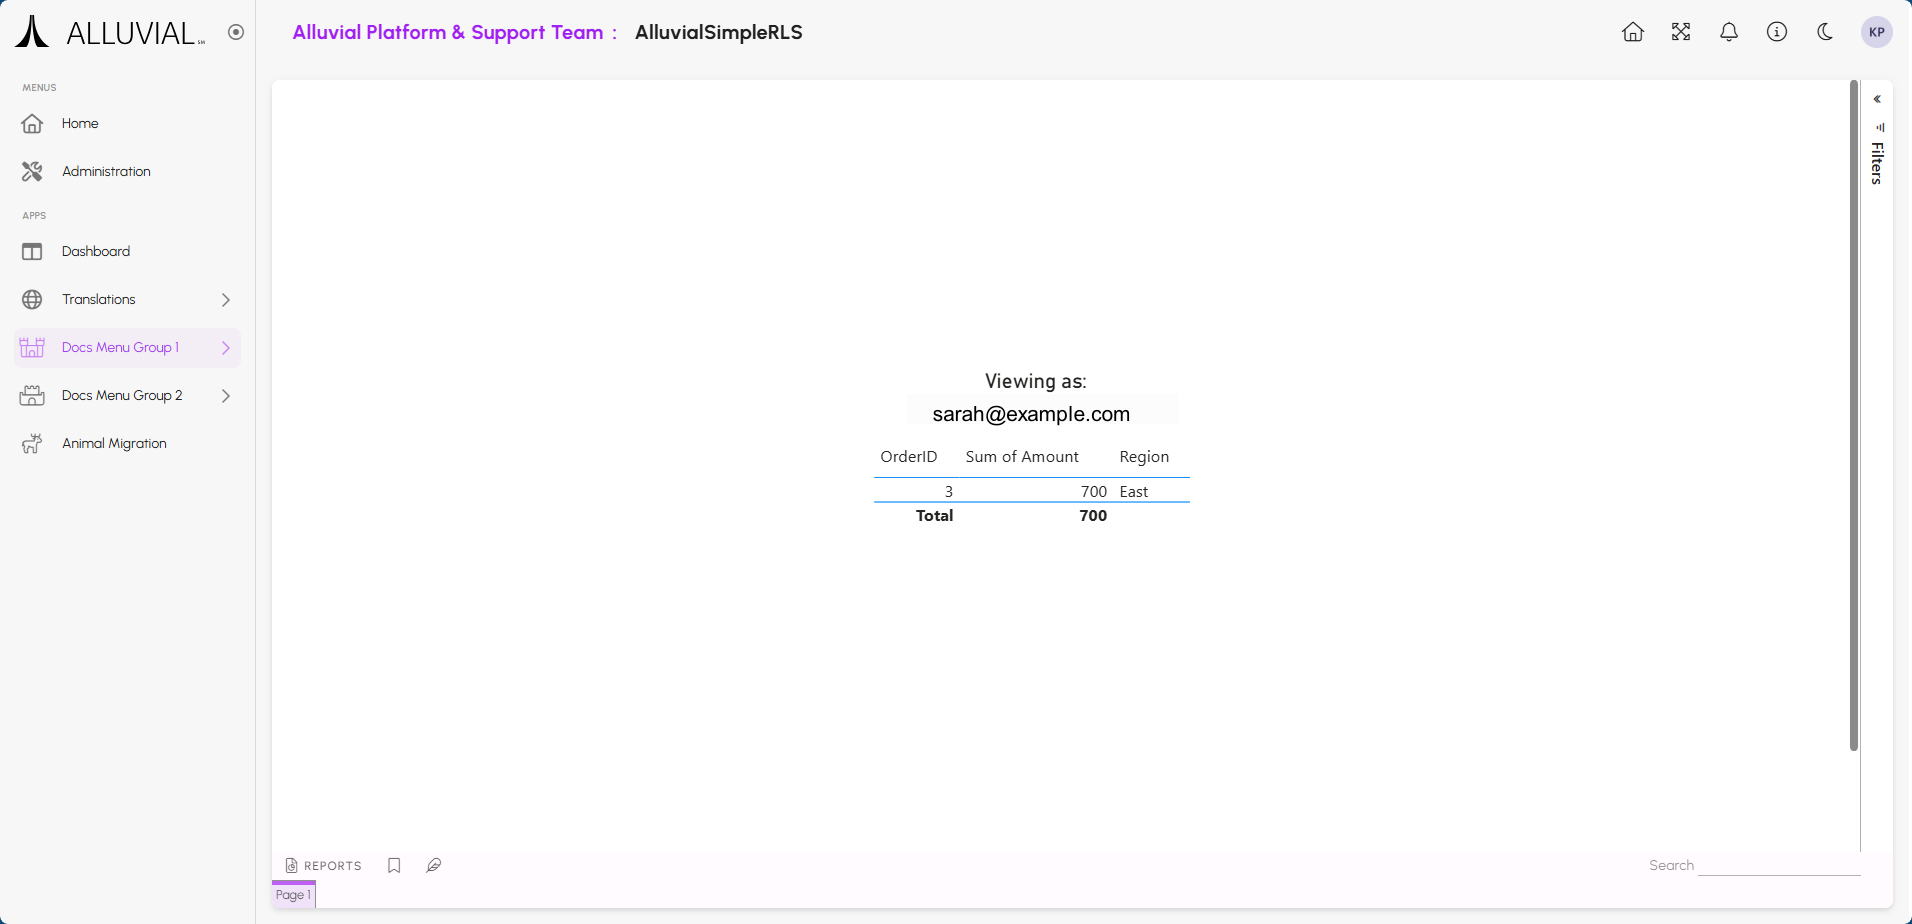
Row-Level Security (RLS)
Alluvial supports Power BI's Row-Level Security (RLS) feature, which restricts data access for users based on their roles. This ensures that users only see data relevant to them, enhancing data security and compliance.
IMPORTANT: Please see the official Row-level security (RLS) with Power BI for detailed instructions on setting up RLS in Power BI.
Set Up RLS in Power BI for Alluvial
When you authenticate to Alluvial using your e-mail address, the user principal name (UPN) is passed to Power BI. You can leverage this UPN in your RLS configurations to filter data based on the logged-in user. The e-mail address used for Alluvial authentication must match the e-mail address in Power BI for RLS to function correctly.
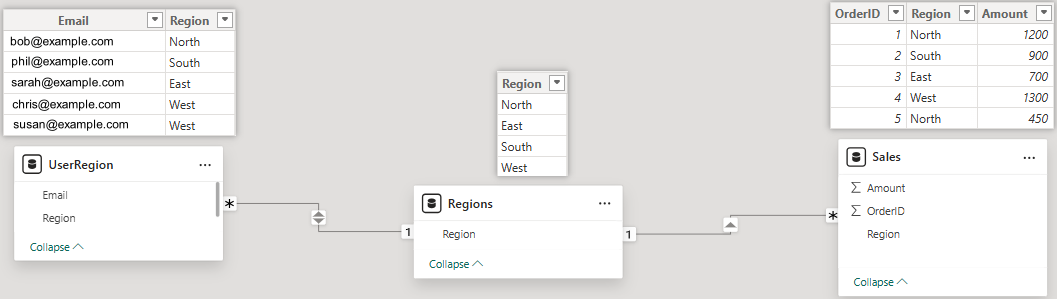
In the relationship diagram below, UserRegion has a many-to-one relationship with the Regions table based on the Region column. The Regions table contains a single Region column with unique values.
The security filter is applied in both directions, and the cross-filtering behavior is set to Both. This setup ensures that when a user logs in, they only see data corresponding to their assigned region.
The Regions table is then related to the SalesData table using a one-to-many relationship based on the Region column. The cross-filtering behavior is set to Single.
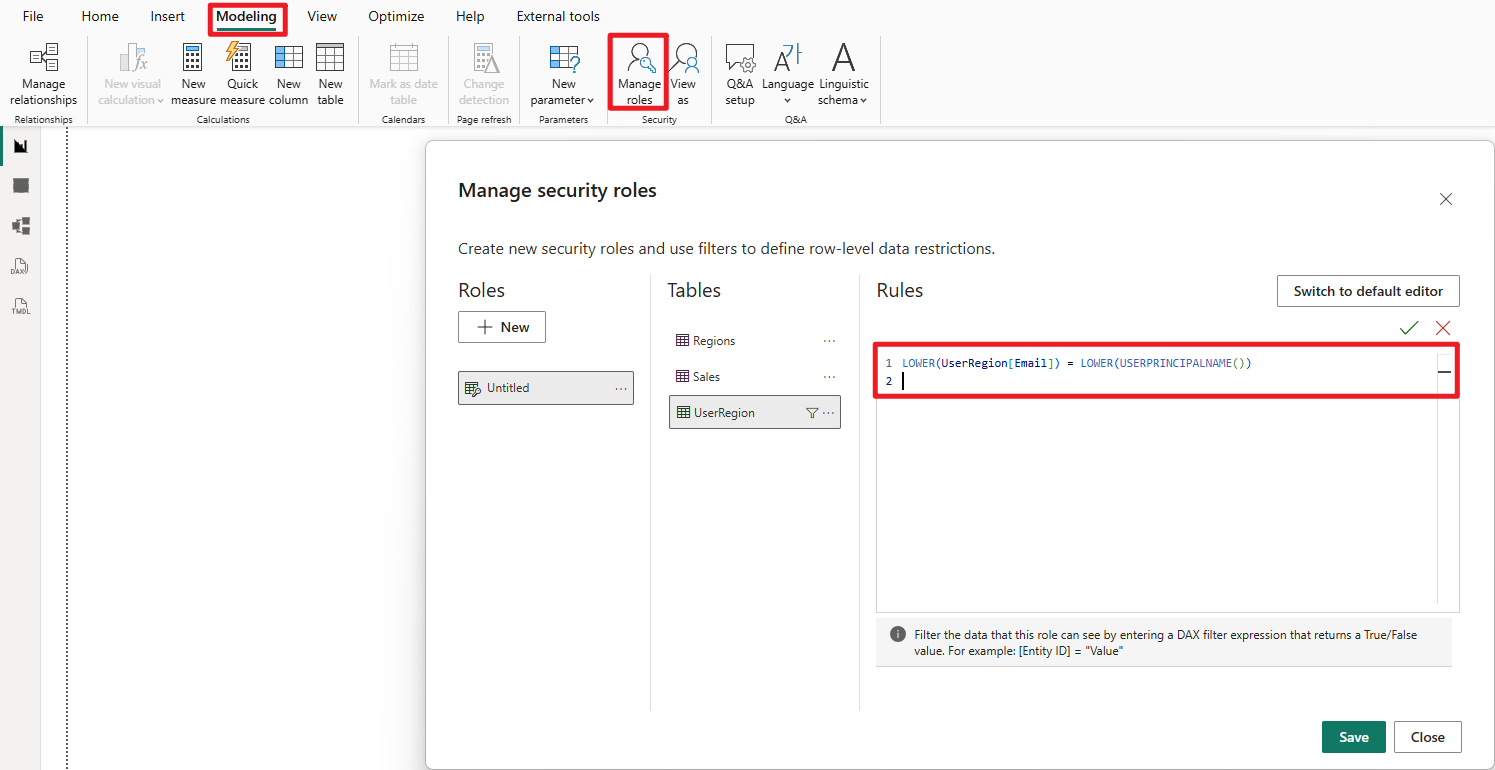
After the relationships have been set, you will need to create a new role called "Principal" on the UserRegion table. In the DAX expression for this role, you will filter the UserRegion table based on the UPN of the logged-in user. The DAX expression will look like this:
LOWER(UserRegion[Email]) = LOWER(USERPRINCIPALNAME())
With the table relationships established and the role created, you can now publish the report to your Power BI workspace. Once published, when users access the report through Alluvial, they will only see data that corresponds to their assigned region based on the RLS configuration.